For our final example of building Dashboards and UIs we’ll use a generic technique we’ve experimented with before. That’s the web service approach that uses a http node to allow us to accept http requests and return web pages. We used this approach in example 1.3 but didn’t explain the details. Continue reading “Lecture 7: Node-Red dashboards (Part 3)”
Tag: IoT
Lecture 7: Node-RED dashboard (Part2)
This second example uses the built in dashboard nodes that come with Node-RED. Before we start, make sure you have installed the dashboard nodes (node-red-dashboard) using the Menu - Manage palette option and search for node-red-dashboard, or run the following command in your Node-RED user directory – typically ~/.node-red
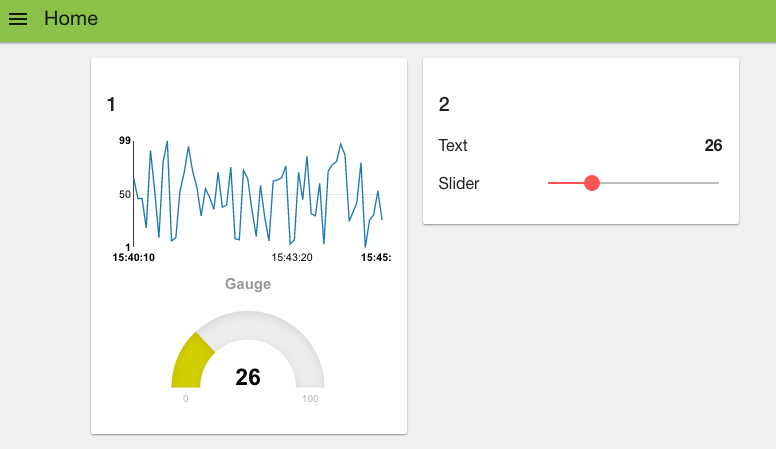
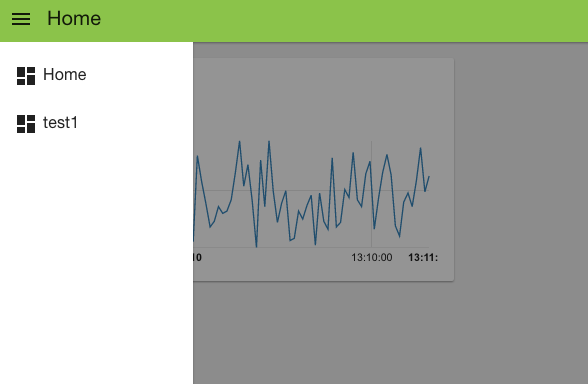
Our goal is to create a dashboard like the one shown below
To start, let’s wire up a simple flow that sends a random number between 0 and 99 to a simple chart. For that you’ll need an inject node to repeatedly fire every few seconds, a function node to generate the random number and one of the node-red-dashboard nodes – in this case the chart node.
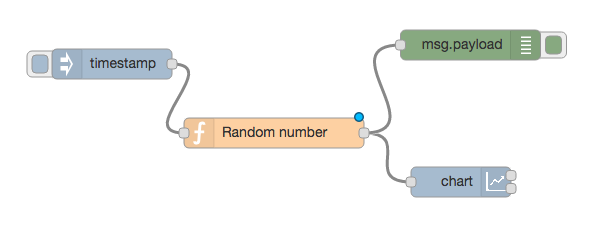
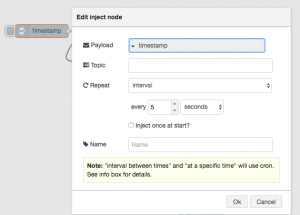
Before we look a how the chart node works, let’s configure the inject node to send a timestamp every 5 seconds by setting the payload to timestamp and the repeat field to an interval of 5 seconds.
This will act as our repeating trigger. Now we need to set up the function node to generate a random number – we’ll use a simple JS math function to do this:
msg.payload = Math.round(Math.random()*100);
return msg;
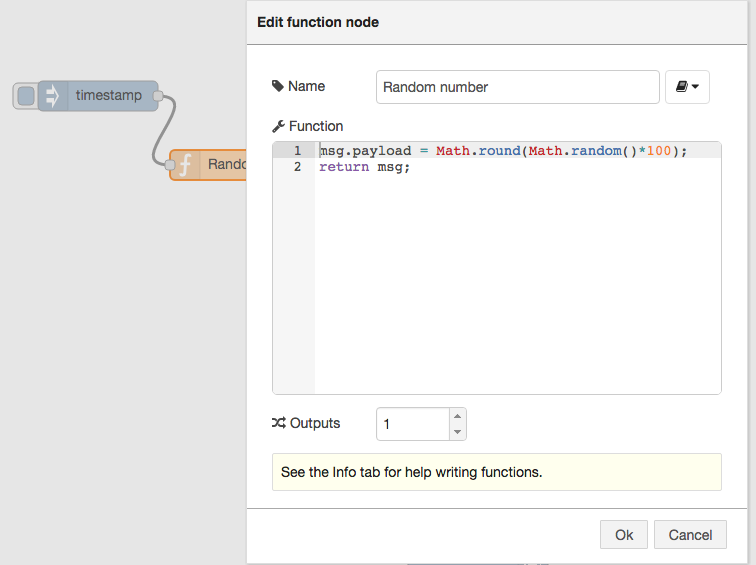
This will generate a random number between 0 ~ 99 which is passed to the chart node.
So now let’s take a look at the chart node. When you double click it, you’ll see it’s configuration options:
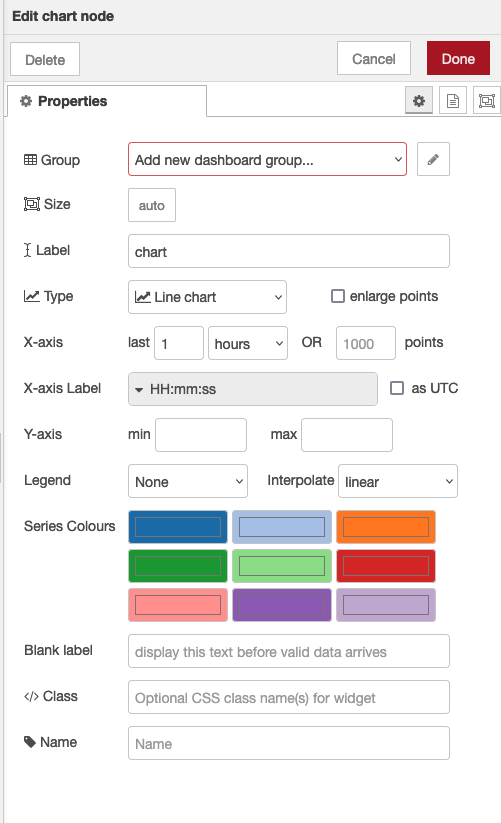
If you click on the button of the Group field, you will be prompted to configure the groups of the UI. If you select “add new dashboard group” you can define tabs for the dashboard and ui groups on those tabs.
- The Tab option allows you to specify which tab of the UI page you will see the UI element on – in this case our chart. The default tab is Home – which we are using here. If you select the edit button to the right of the Tab field you can create a new tab and then select that. However, we’ll use the default home for now.
The Label field is name shown when displaying the chart – by default this is chart but you can set it to anything you like.
The Group field also allows you to group UI elements – we’ll show you how that works when we add another UI element so let’s use group “Default[Home]” for now – of course, you can use any string you like.
The Type field allows you to select various types of chart, we’ll use the default line chart here.
The X-axis field allows you to tell the chart how much data it should store and display – the longer the ‘last‘ filed is set to, the more data is stored and displayed by the chart. Let’s use a short 5 mins which will start to throw away the data that is 5 minutes old.
Lastly the Interpolate field defines how the chart will interpolate values in between actual data values it receives, you can select between linear, step, b-spline and cardinal – which are standard interpolation algorithms. We’ll use the default linear.
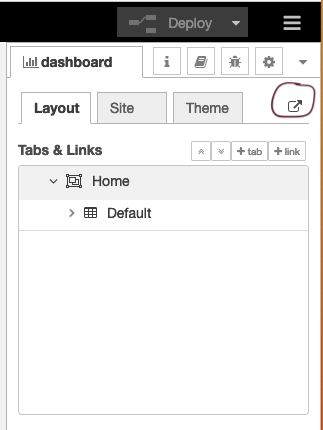
Wire these nodes up, hit the deploy button – check that your debug node is showing that random values are showing. Then head over to your default dashboard page to see the results. You can see your dashboard by selecting view->dashboard from the main menu and then clicking the ‘goto’ icon (circled below).
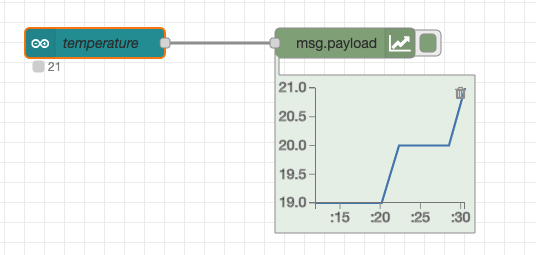
When you visit that page you’ll see your initial chart as shown below:
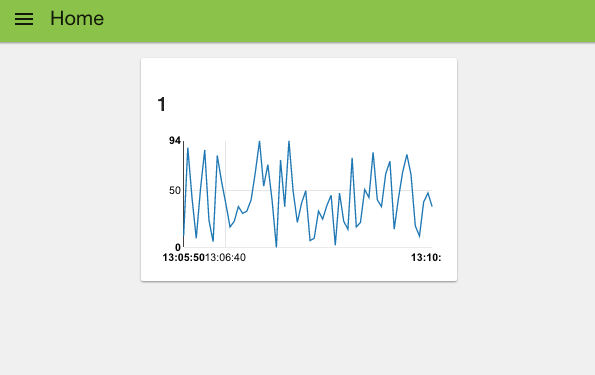
As you can see, you get a nice line chart, scaled for your data values (X axis) and the time they arrived (y axis). You can also see “Default” at the top left of the chart, indicating this is UI group “Default” – which is the group name we set in the configuration fields for the chart node.
If you look at the top left of the web page, you can see that we are, by default, on the home tab. If you had created your own tab then when you click the selector top left you’ll get a pull down menu of your tab options:
That was pretty simple, let’s add a few other UI elements to our dashboard. Firstly let’s create a gauge to show the last data value sent. Drag a Gauge node from the UI palette and wire it to the Random Number function node.
Then double click to open up and let’s configure it:
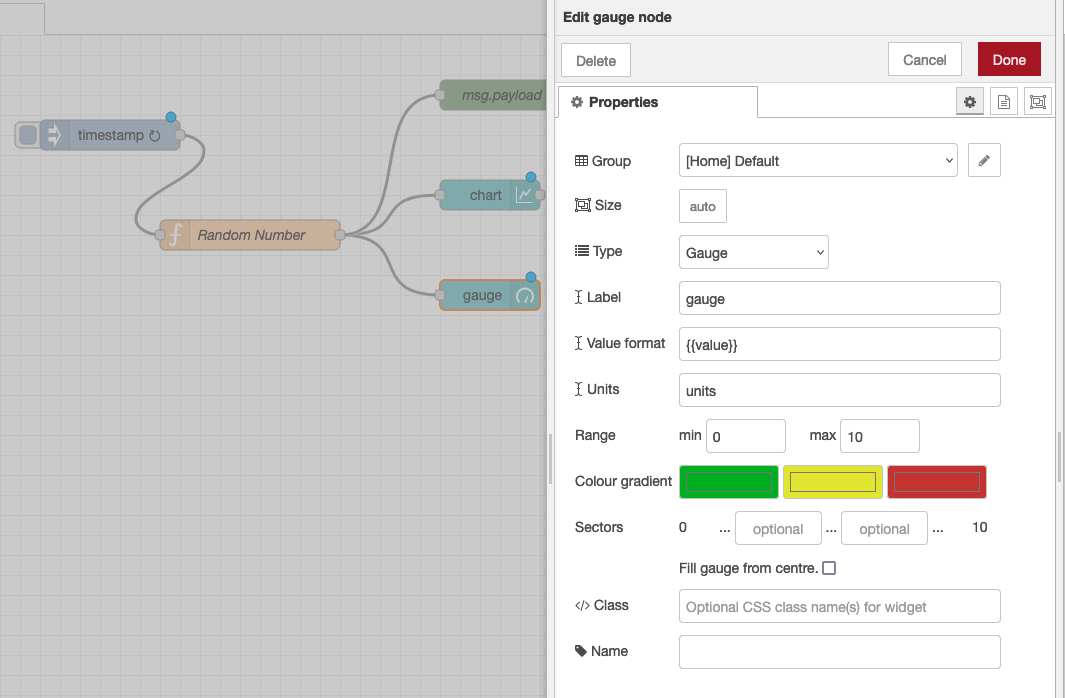
We’ll us the same Tab, home and we’ll also add it to the same group – “Default[Home]”. The Min and Max fields allow you to set the min and max values the gauge will shown. Make sure the max is set to 100 which is the most that the random number function node will generate. You can also change the Colour gradient to show different colours on the widget, but we will leave it as default for now.
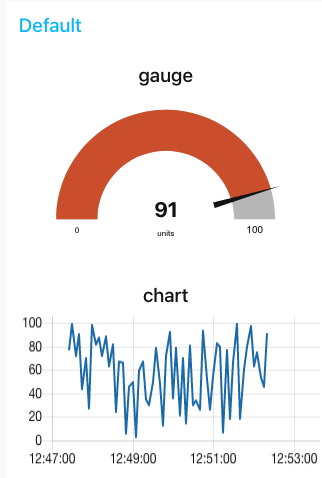
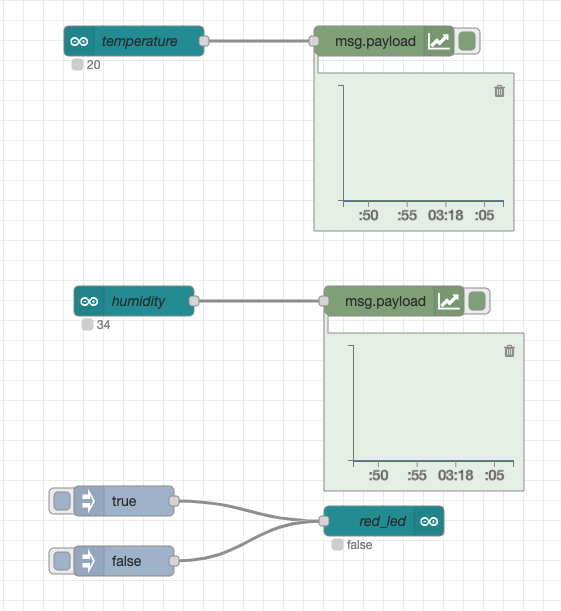
Hit deploy and then head over to your dashboard and you’ll see that the chart and gauge are displayed in a group with the chart now showing the last 5 minutes of data and the gauge the latest value.
As a last example, let’s use a couple of the other UI nodes, a slider node and a text node to show the same data on a slider and as a text string.
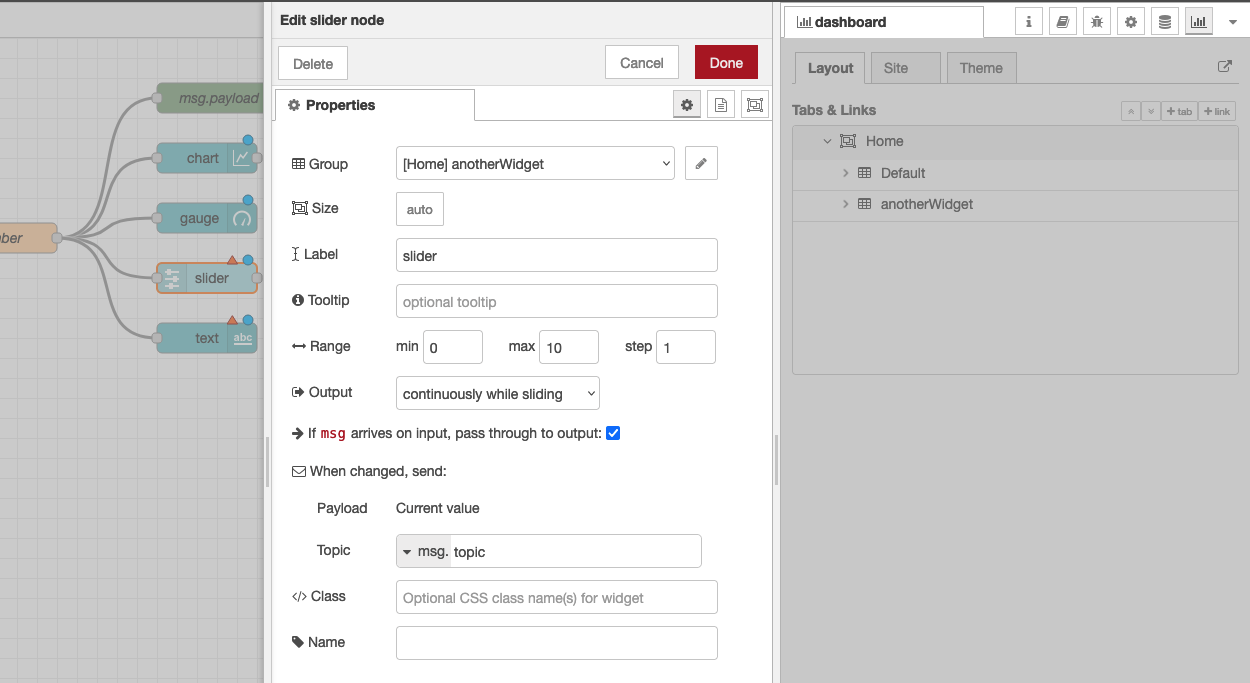
For these two nodes, configure them to use the same tab – “Home” but use group name “anotherWidget”(You will need to click “Add new UI_group” from the drop down menu of the Group field, and then click the edit button). You will also need to change the min and max value for the slider node to show the correct position of the slider. Deploy those and let’s take a look at your dashboard. As you can see, we now have two widget groups, group “Default” with a chart and a gauge, group “anotherWidget” with a text filed and a slider. Simple eh?

In the dashboard tab beside your debug tab, you can also set the theme and order of the elements. If you don’t see the dashboard tab, click the menu button at top right corner, then select “View” -> “Dashboard”. You can see all the widgets and tabs showing in a tree structure, and you can easily drag the elements to change the orders that they are presented in the dashboard.
Now you’ve got the basics sorted out, play around with the different dashboard elements to build your own dashboards using some real world data – have fun!
Part 1 Part 3
About Sense Tecnic: Sense Tecnic Systems Inc have been building IoT applications and services since 2010. We provide these lectures and other tutorials as a service to the community.
Node-RED: Lecture 7 – Dashboards and UI techniques for Node-RED
In this lecture you will take a look at a few techniques to allow you to visualize data passing through flows. We’ll focus on three approaches, the use of a third party dashboard tool, FreeBoard (Part 1), using the default Dashboard UI nodes provided by default in Node-RED (Part 2) and a general technique using a standard JavaScript charting tool (Part 3). Continue reading “Node-RED: Lecture 7 – Dashboards and UI techniques for Node-RED”
Node-RED: Lecture 6 – Intermediate flows
This lecture will build on the ideas you saw in lecture 5 and focus on examples that explore some of the key concepts from that lecture. These include the ideas of context, messages and sub-flows. The examples in this lecture are a little more complex than previous examples Continue reading “Node-RED: Lecture 6 – Intermediate flows”
Tutorial: Node-RED dashboards – creating your own UI widget II (using external charts)
Node-RED’s dashboard nodes provide a comprehensive set of UI components for building basic dashboards suitable for the Internet of Things (IoT) – offering graphs, gauges, basic text as well as sliders and inputs. However, there will always be situations when you need something custom. The template node is the solution and in this tutorial we’ll show you a quick example of using it to create your own UI widget. Continue reading “Tutorial: Node-RED dashboards – creating your own UI widget II (using external charts)”
Extending the Arduino IoT Cloud with a cloud hosted Node-RED
Augment an Arduino-based weather station with external service notifications using a Cloud-hosted Node-RED service.
Published Dec 2021 – updated Aug 2023
Introduction
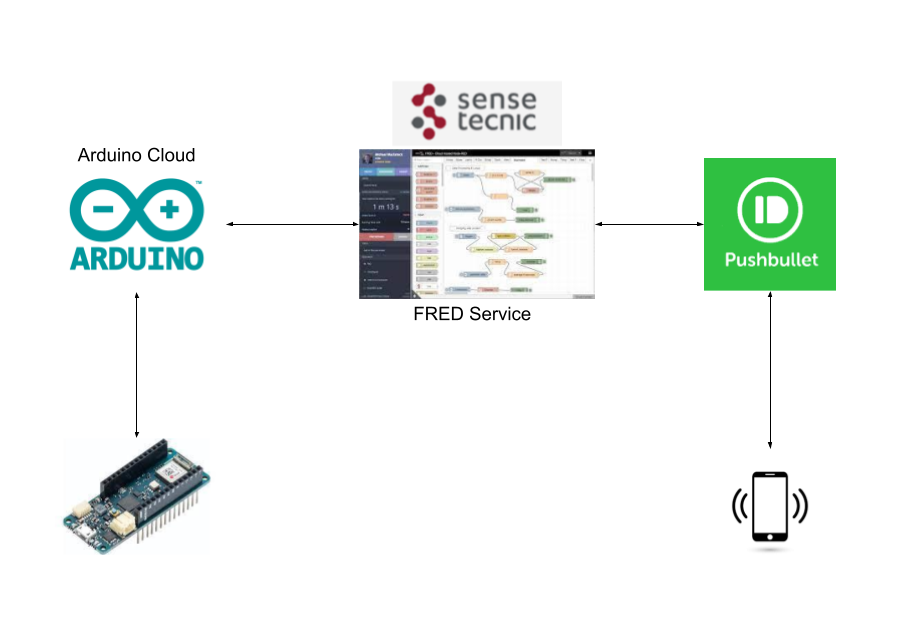
In this tutorial we’ll show you how to augment the Arduino Cloud service using a cloud-hosted Node-RED service for some simple data processing and notifications. This is a common use-case for Hosted Node-RED and Arduino Cloud. Arduino cloud offers a basic data gathering and dashboard facility, and the hosted Node-RED is used as a general purpose programming system to add value to the Arduino cloud.

Once you master this basic pattern – of offloading processing from Arduino to a cloud hosted Node-RED, you can use it for a variety of use cases, such as:
- Adding sophisticated cloud processing such as complex event management or cloud based machine learning to analyse your sensor data
- Leveraging third party service via FREDs easy nodes – eg IBM Watson, GE’s Predix or external DB services such as InfluxDB
- Gathering and combining data from multiple locations and sensors, combining with public data like traffic or weather and building complex, interactive dashboards.
For this tutorial, we’ll create a connected temperature and humidity sensor using an Arduino MKR WiFi 1010 connected to a DHT11 sensor. We’ll also add an external LED to indicate when the temperature is too high or low.
We’ll show you how to connect this device to the Arduino cloud service, create a ‘Thing’ in the service that exposes several properties corresponding to the sensors and LED. We can then use the arduino-cloud dashboard to interact with the device.
Finally, we show how we can develop a simple processing flow in Node-RED, that uses the arduino-cloud nodes available on the cloud Node-RED service to connect to the “Thing” on the arduino cloud and do some simple data processing as well as send data to an external notification service. For this tutorial we’ll use the PushBullet service.
Note – when we wrote this tutorial in 2021, we used the FRED cloud hosted Node-RED service. As of August 2023 that service is no longer available. An alternative is the FlowForge cloud hosted Node-RED which has taken over some of the FRED customers. This tutorial has not (yet) been tested with FlowForge, however the approach and flow is the same – although some details of UI etc differs between FRED and FlowForge.
An overview of the set up is shown below.
This tutorial will talk you through the 4 main steps:
- Setting up the Arduino Weather Station Prototype board
- Connecting to the Arduino IoT Cloud
- Developing the Node-RED flow on FRED
- Connecting to the Pushbullet external notification service
The Weather Station Prototype
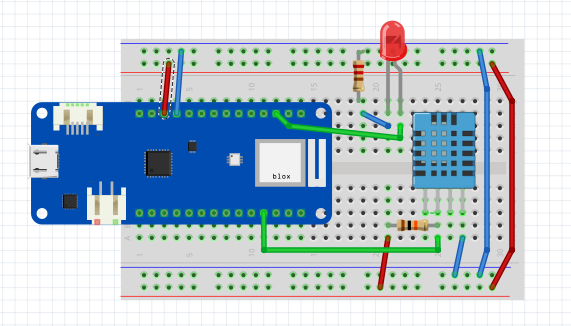
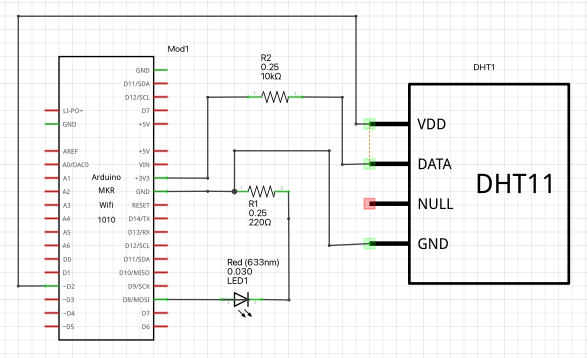
The prototype weather station device we’ll use is shown in Figure 2.
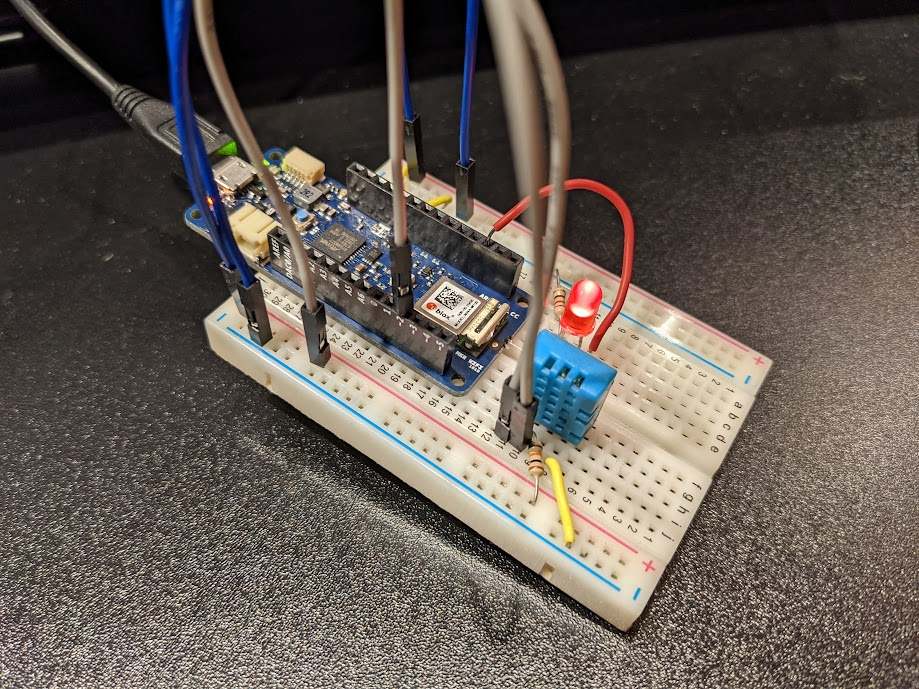
For this prototype you’ll need the following:
- Arduino MKR Wifi 1010 with USB cable to connect to your PC
- breadboard and jumper cables
- An LED
- 220 ohm and 10K ohm resistors
You can wire up the device as shown in Figure 3.
Testing the Device Using a Local Sketch
To ensure the device works, we’ll upload a test program into the device that reads from the sensors and blinks the LED every two seconds. The test program in the Appendix Listing 1 blinks the LED, reads the DHT11 sensor and sends the current readings to the serial monitor output.
To upload this sketch, you’ll need to install and run the arduino editor and connect the device to your Mac or PC using a USB cable. While you can download and run the arduino IDE locally, for this tutorial, we’ll use the arduino web-editor. To get started see the Getting Started with Web Editor tutorial.
To use the web editor, you need to create an Arduino account. (You’ll need to do this to use the arduino cloud service later anyway so now is a good time to get that done.) Once you have an account, you need to install a browser plugin. Finally ensure your Arduino board plugged into the USB port is recognized by the computer.
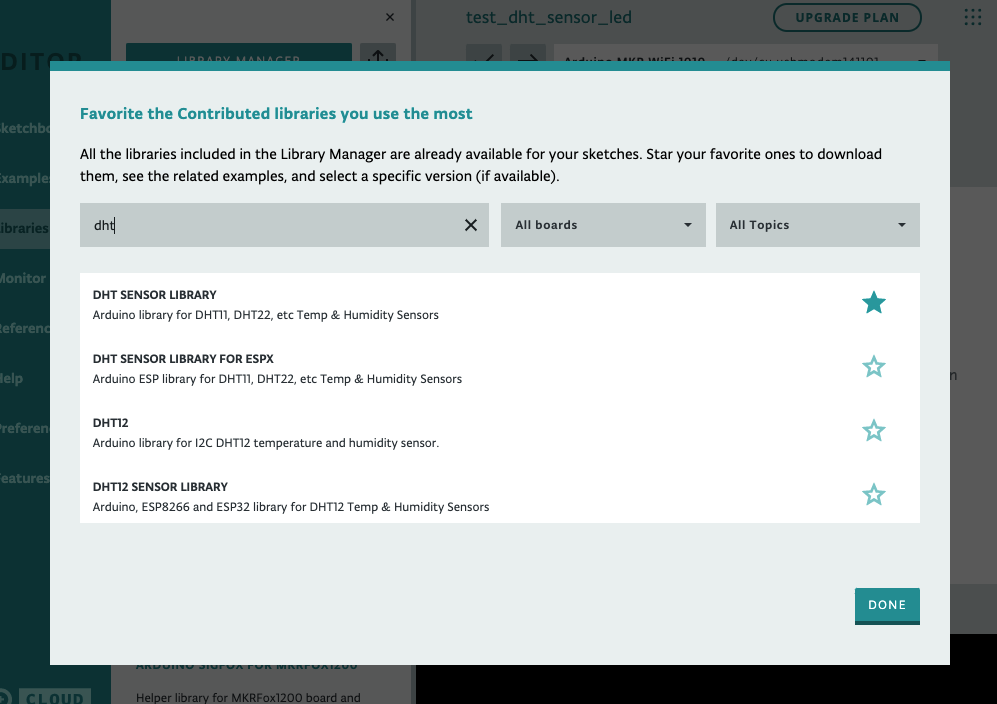
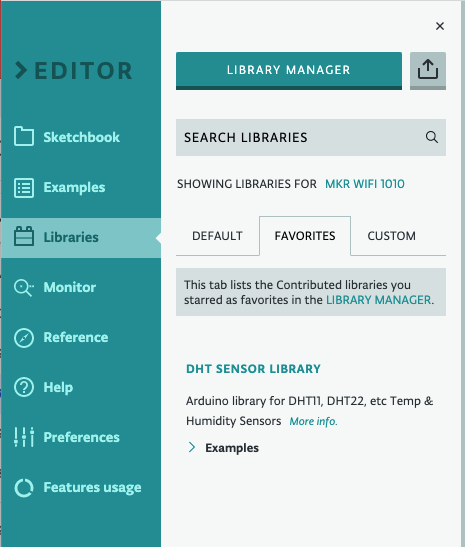
Before you can upload the test sketch, you’ll need to include the DHT Sensor Library. To find it, click on the Library Manager button on the web editor, and then search for DHT as shown in Figure 5. It will likely be near the top as shown. Click on the star to make it available in your favourites so you can use it in your sketches.
You can then copy it to your editor and upload it to your board to ensure the board is working. Once this is done you should see the onboard LED blinking on the board every second.
Click on the Monitor tab to see the following in the monitor:
Humidity: 34.00%  Temperature: 18.00°C 64.40°F  Heat index: 16.74°C 62.14°F
turn LED on
Humidity: 34.00%  Temperature: 18.00°C 64.40°F  Heat index: 16.74°C 62.14°F
turn LED off
Humidity: 34.00%  Temperature: 18.00°C 64.40°F  Heat index: 16.74°C 62.14°F
turn LED on
Humidity: 34.00%  Temperature: 18.00°C 64.40°F  Heat index: 16.74°C 62.14°F
turn LED off
If you have any issues, ensure the DHT11 and LED are connected correctly, ensuring the correct pins are connected, and the polarity of the LED is correct. If all goes well, congratulations, you’ve just built a prototype weather station!
Connecting the Device to IoT Cloud
Next we’ll connect our device to the arduino cloud service. This involves the following steps:
- Adding a “thing” to represent our device and its properties.
- Connecting our device to the IoT Cloud platform.
- Associating the physical device with the thing. This causes some code to be generated to handle the thing properties.
- Updating the code needed to keep the thing properties are kept in sync with the real world weather station device sensor values and state of the LED.
To get started with Arduino Cloud you can follow the Getting started with the Arduino IoT Cloud.
We’ll go through the steps with our specific device.
Adding a Thing
In the IoT Cloud click on Things, and then the Create Thing button.
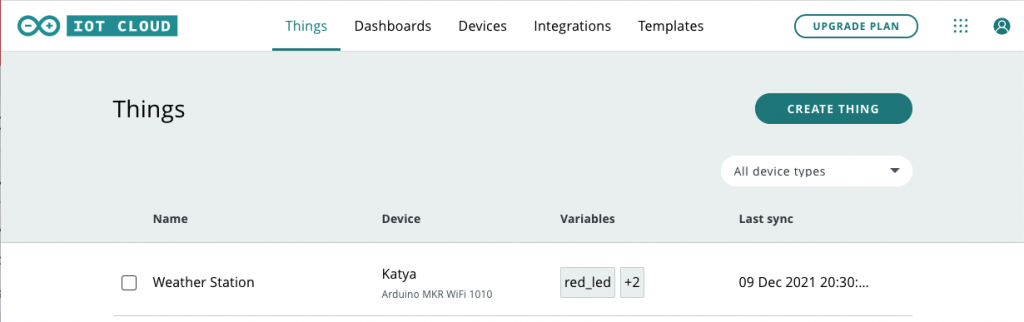
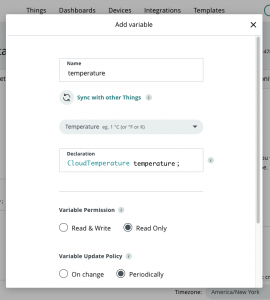
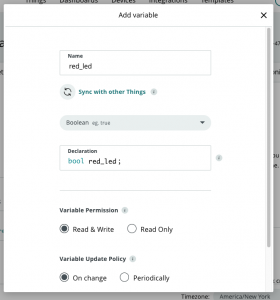
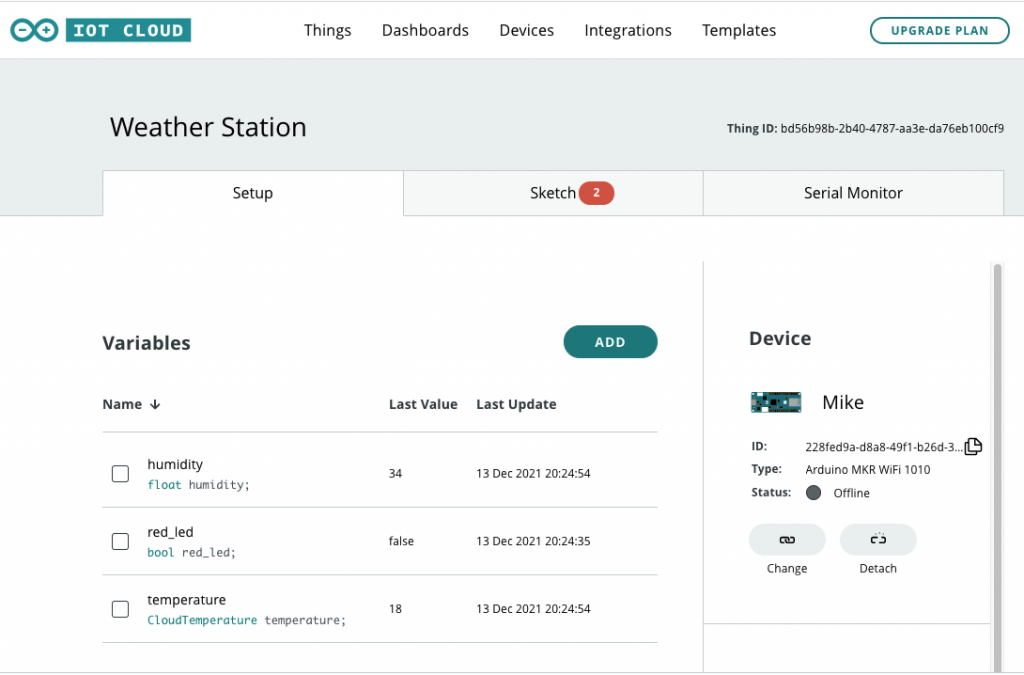
Name your thing appropriately. We used Weather Station. Then, add variables that are associated with the DHT11 sensor and the LED by clicking on Add Variable as shown.
Adding Variables to Things
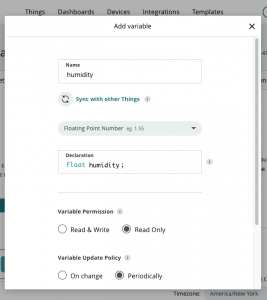
Add the following variables:
humidity – float type as shown. You should configure it in the UI as Read Only, and update periodically every 2 seconds.
temperature – create it as a CloudTemperature type, read-only and updated every 2 seconds. The CloudTemperature type is in the Energy category of types.
red_led – boolean type. This should be configured as Read & Write, and updated On change.
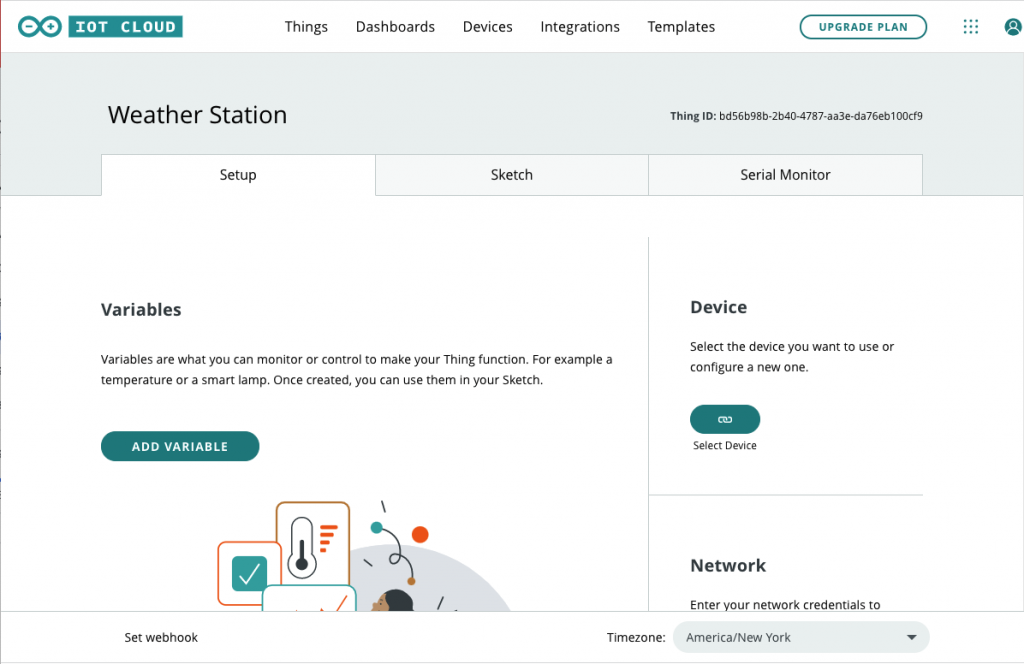
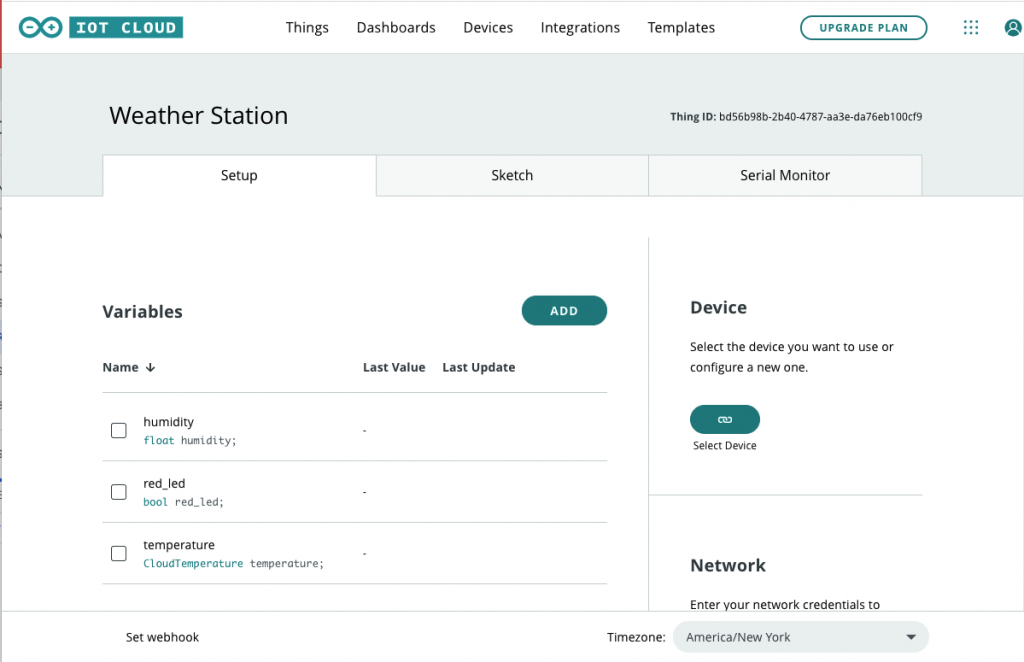
Now we have a Weather Station thing representing our device in the platform as shown.
Next, we need to connect our device to the IoT Cloud!
Connecting our Device
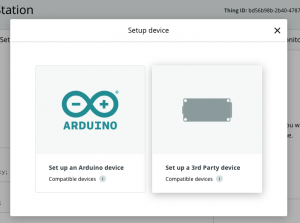
To add our device, you can click on the link/Select Device button and select an Arduino device.
You must then wait for the platform to connect to your local device. If all goes well the browser will display something similar to the following:
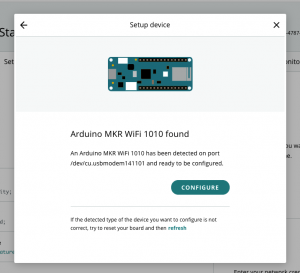
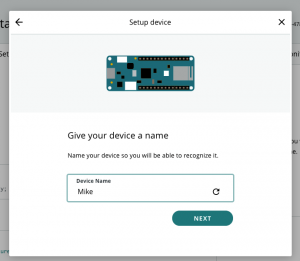
Click on configure, and give your device a name.
Once this is done the platform will upload a new sketch into the device that has the code necessary to communicate with the Arduino IoT Cloud. Click on Done and your device will be shown.
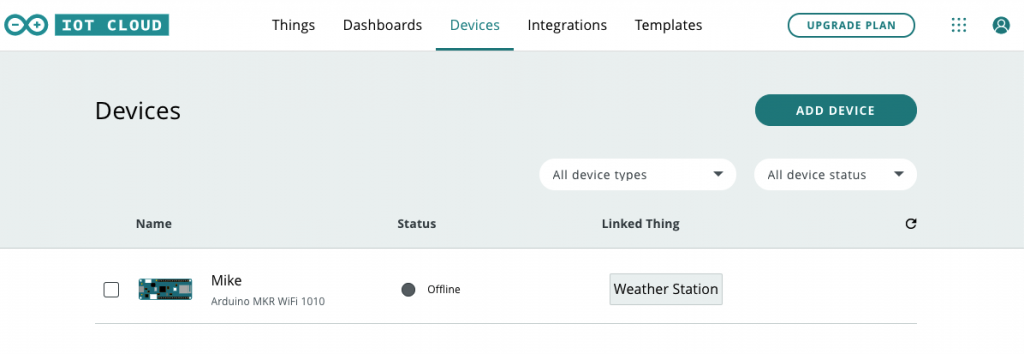
Note that if your device is not linked to a thing as shown you can click on the Things Tab and then click on the Associate Device on the Weather Station thing to link it to your device.
At this point, you have created a thing, added the device, and uploaded a sketch to the device to support communications with the IoT Cloud. Next we’ll modify the sketch to support the DHT11 and the LED.
Update Sketch to Update Thing Properties
To update the sketch you can click on the Sketch tab as shown below. Clock on the Open full editor button to modify the sketch and its configuration in the Web Editor.
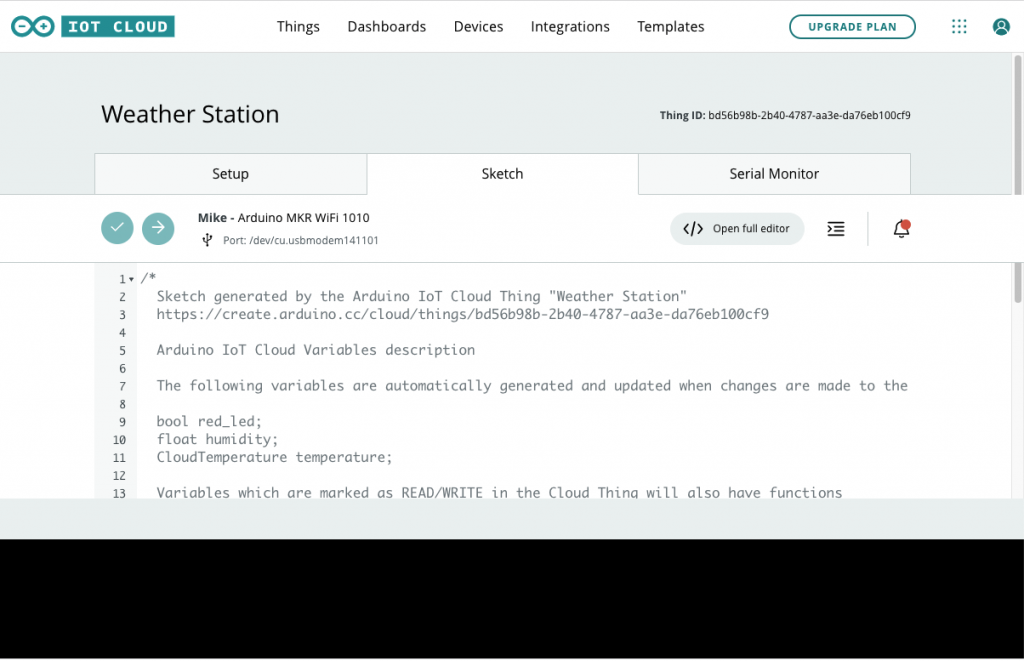
Your Editor will look something like the following.
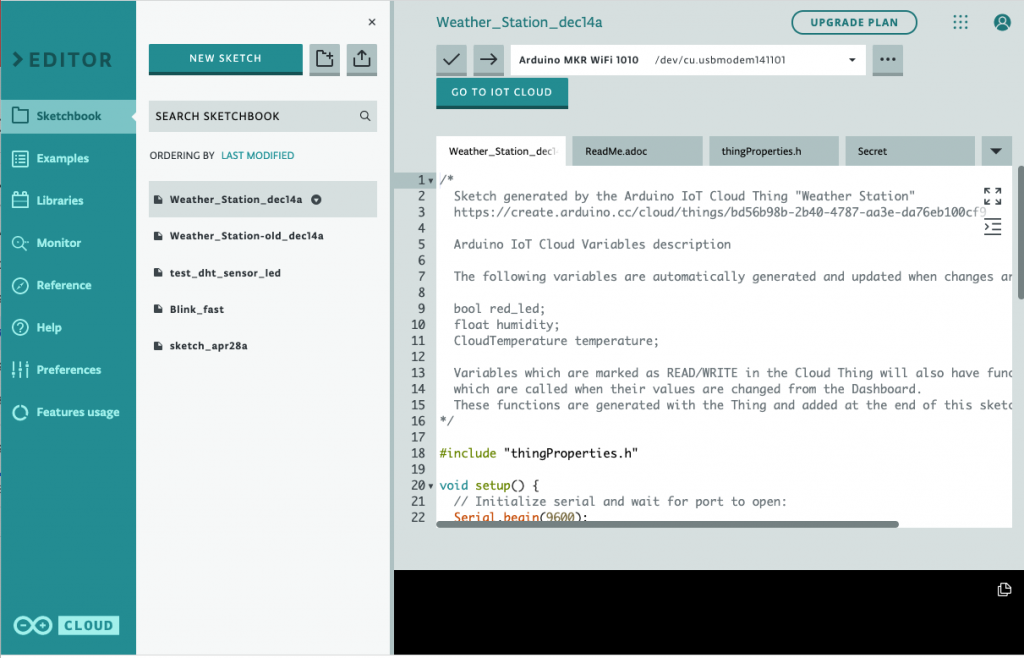
Click on the Secret tab and ensure the SSID and password for your wifi network is set correctly.
Notice the template sketch provided by the platform (See Appendix Listing 2) provides placeholders for you to fill in the loop code and onRedLedChange() with your own code. This is where we need to add the code to read our sensor and turn the LED on and off.
Before we can read the DHT11 we need to include the library. Click on the Libraries tab and then your favourites for the DHT11 library, and then Include the DHT11 library.
Now, replace the sketch generated by the platform with the code in Appendix Listing 3 following (copy paste into the same file). This will fill in the loop() and onRedLedChange() methods and set up the DHT11 sensor reading.
Click on the Upload and Save -> button to upload and save this new sketch into the Arduino. If all goes well, your device will now keep the IoT platform thing variables up to date as shown.
Developing Node-RED Flow on FRED
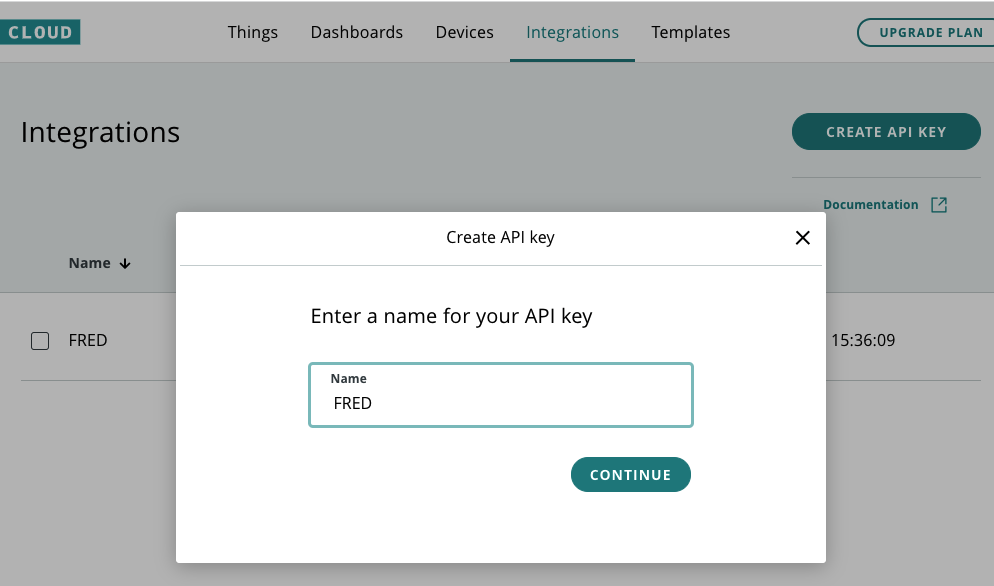
Next we’ll create an API key on the IoT Cloud to connect to FRED to do additional processing and notifications.
First, click on the Integrations tab, and then click on Create API Key. Give the API key a name such as FRED.
Setting up the cloud Hosted Node-RED service
Create an account on the your cloud-hosted Node-REd service of choice. We originally used FRED – however it is no longer available.
Once you’ve created an account and validated your email, you will be able to login and see a standard Node-RED instance for creating your flows. Before we can create our flow we need to install the Arduino IoT Cloud nodes. Click on the Add or Remove Nodes tab on the left as shown below.
If you are new to Node-RED, you can find several introductory tutorials and a complete programming course at our Node-RED programming guide.
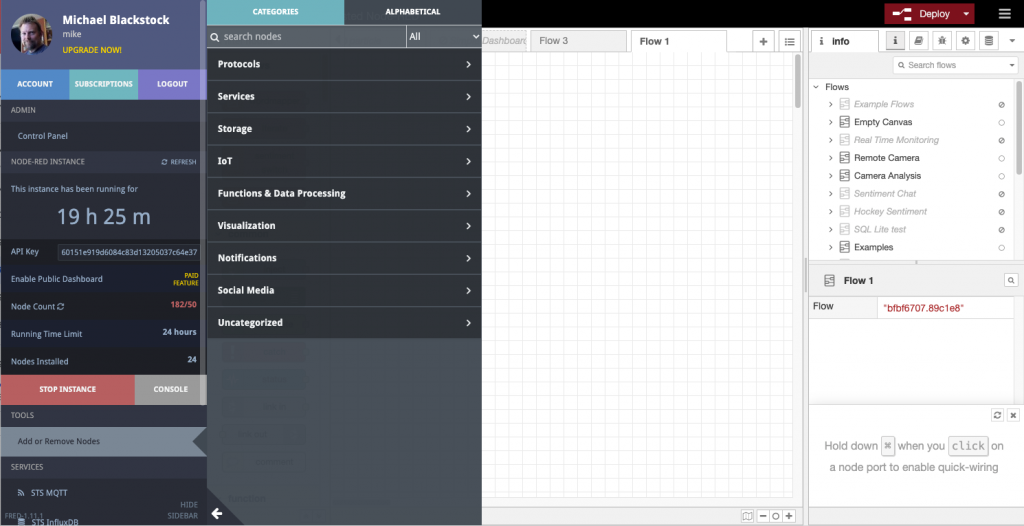
Search for Arduio and install the Ardiuno-Iot-Cloud nodes. For debugging and simple charts we’ll use the Dataviewer node, and the Pushbullet node for notifications; install those as well.
We’ll initially create a flow that connects to the IoT Cloud and displays information and controls the LED.
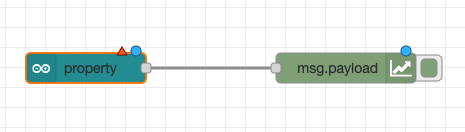
First, drag a property node, and a data viewer node to display the data in a chart in the flow as shown.
Next, configure the property node by double-clicking on it. You’ll get the following modal.
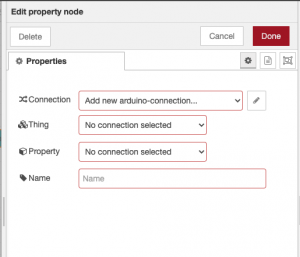
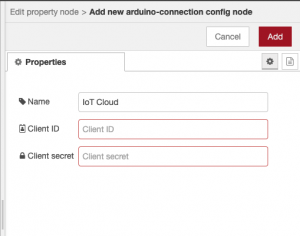
Create a new arduino-connection by clicking on the pencil icon and fill in your Client ID and Client Secret you recorded when you configured your integration.
Click on Add. Your property node is now configured. The node will communicate with the IoT cloud to retrieve the Things and properties it can interact with.
Select the thing for the property, “Weather Station”, and the temperature property.
Deploy the simple two node flow, and if all goes well, temperature readings should begin to appear in the data viewer. The current value also appears under the property node as shown. To see the values themselves, you may add a debug node to the property output as well.
Congratulations, you’ve connected FRED to the Arduino IoT Cloud! Next, we’ll add the humidity and LED control nodes using the following flow.
The flow illustrated above is shown in Appendix Listing 4. You can import this flow by Click on the hamburger icon in the top right, choosing Import and then copying and pasting this listing into the import dialog as described in the Node-RED documentation.
Given a few seconds you should now see both the current temperature and humidity readings and have the ability to control the LED.
Going Further: Adding High Temperature Notifications
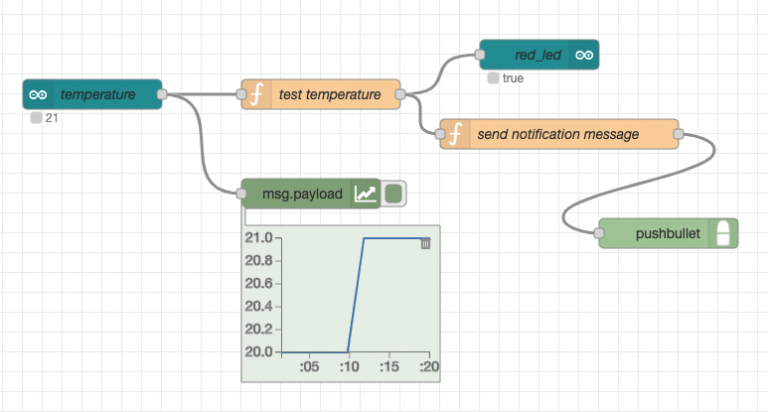
Let’s take this a bit further and create a flow that lights the LED and sends a notification when the temperature rises above 20 degrees. We’ll then extend this to send notifications via Pushbullet. First, we’ll create a flow to detect the temperature and light the LED.
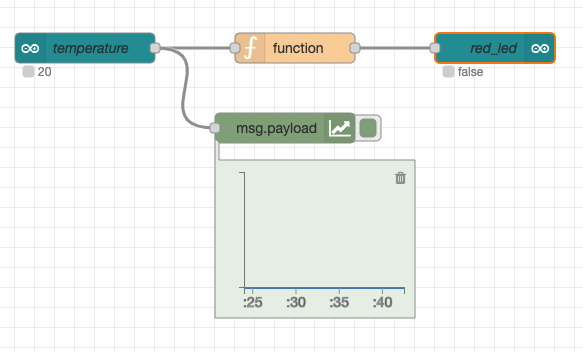
The flow shown above can be imported from Appendix Listing 5. Note that the function node here is very simple; it sends a true or false in the output message payload depending the value of the message payload received:
if (msg.payload > 20) {
    msg.payload = true;
} else {
    msg.payload = false;
}
return msg;
This can easily be extended to do additional processing, perhaps a dynamic threshold, or check that the temperature is below freezing.
Connecting to Pushbullet
Next, let’s connect Pushbullet for remote notifications. To use this service, you’ll need to sign up, install Pushbullet on your phone or computer and then create an API key.
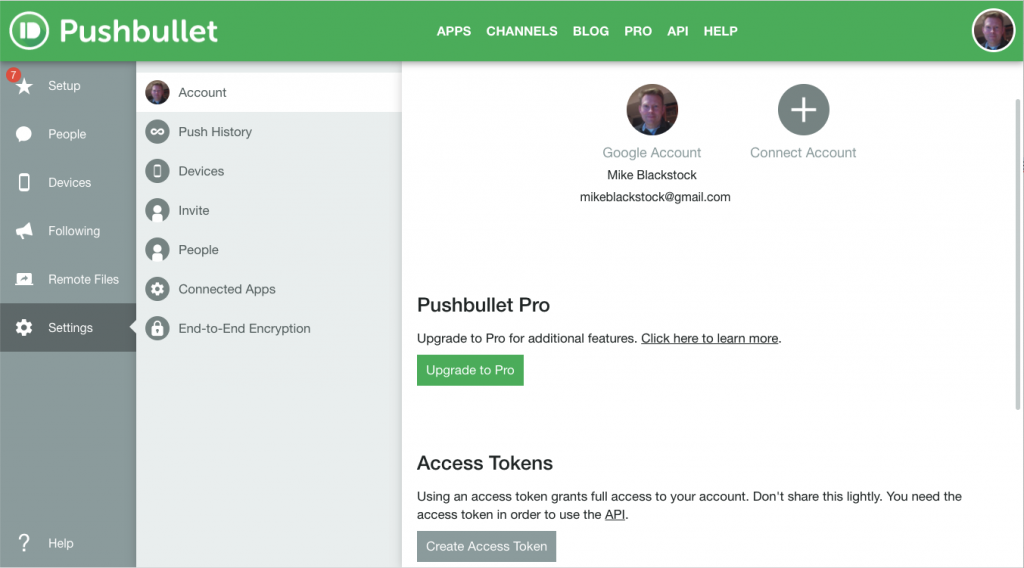
Record the API key (access token) provided; this will be used to connect FRED to pushbullet.
Now, add a pushbullet node to your flow as shown. Configure it to push to your devices by providing the API key.
Now, you can modify the flow to include a function node to send notifications to Pushbullet when the temperature test transitions to true as shown.
The associated flow can be imported from Appendix Listing 6.
Note that the send notification function node uses the Node-RED context feature to maintain state about whether a notification has been sent already. For more information on how Node-RED context works see the associated documentation.
The function Setup code (in the function node Setup tab) is as follows:
if (context.get("notificationSent") === undefined) {
    context.set("notificationSent", false);
}
The function node code that sends the notification is as follows:
let notificationSent = context.get("notificationSent");

if (msg.payload) {
    if (!notificationSent) {
        msg.payload = "Temperature is too high!"
        context.set("notificationSent", true);
        return msg;
    }
} else {
    context.set("notificationSent", false);
}
Now, when the temperature transitions more than 20 degrees, the LED will light, and you’ll get a Pushbullet notification on your device!
Note that free pushbullet accounts are limited to 500 notifications per month so do not leave this flow running otherwise you may exceed your limit!
Conclusion
The Arduino IoT Cloud makes it very easy to connect Arduino devices and visualize basic sensor data. However, if you want to create simple IoT applications for monitoring and control, then you need a general purpose service such as FRED. By combining FRED and the Arduino IoT Cloud, you get the ease of connectivity of Arduino and the power and flexibility of FRED – a winning combination!
Appendix
This appendix contains the Arduino device sketches and Node-RED flows hosted by FRED that needed for this tutorial.
Listing 1
Test program for the weather station prototype device
Open to view/copy code
/*
  Test weather station sketch
*/
#include <DHT.h>
#include <DHT_U.h>

#define DHTPIN 2
#define DHTTYPE DHT11

const int ALERT_LED = 8;      // the number of the LED pin
bool led_state = false;

DHT dht(DHTPIN, DHTTYPE);

void setup() {
  pinMode(ALERT_LED, OUTPUT);

  // initialize the DHT sensor
  dht.begin();

  // Initialize serial and wait for port to open:
  Serial.begin(9600);

  // This delay gives the chance to wait for a Serial Monitor
  // without blocking if none is found
  delay(1500);
}

void loop() {
  delay(2000);

  // Reading temperature or humidity takes about 250 milliseconds!
  // Sensor readings may also be up to 2 seconds 'old'
  // (its a very slow sensor)
  float h = dht.readHumidity();

  // Read temperature as Celsius (the default)
  float t = dht.readTemperature();

  // Read temperature as Fahrenheit (isFahrenheit = true)
  float f = dht.readTemperature(true);

  // Check if any reads failed and exit early (to try again).
  if (isnan(h) || isnan(t) || isnan(f)) {
    Serial.println(F("Failed to read from DHT sensor!"));
    return;
  }

  // Compute heat index in Fahrenheit (the default)
  float hif = dht.computeHeatIndex(f, h);
  // Compute heat index in Celsius (isFahreheit = false)
  float hic = dht.computeHeatIndex(t, h, false);

  Serial.print(F("Humidity: "));
  Serial.print(h);
  Serial.print(F("%  Temperature: "));
  Serial.print(t);
  Serial.print(F("°C "));
  Serial.print(f);
  Serial.print(F("°F  Heat index: "));
  Serial.print(hic);
  Serial.print(F("°C "));
  Serial.print(hif);
  Serial.println(F("°F"));

  if (led_state) {
    Serial.println("turn LED on");
    digitalWrite(ALERT_LED, HIGH);
    led_state = false;
  } else {
    Serial.println("turn LED off");
    digitalWrite(ALERT_LED, LOW);
    led_state = true;
  }
}
Listing 2
Template sketch generated by the IoT Cloud to communicate with the IoT Cloud that provides placeholders to update variables.
Open to view/copy code
/*
  Sketch generated by the Arduino IoT Cloud Thing "Weather Station"
  https://create.arduino.cc/cloud/things/xxx-xxx-xxx-xxx-xxx

  Arduino IoT Cloud Variables description

  The following variables are automatically generated and updated when changes are made to the Thing

  bool red_led;
  float humidity;
  CloudTemperature temperature;

  Variables which are marked as READ/WRITE in the Cloud Thing will also have functions
  which are called when their values are changed from the Dashboard.
  These functions are generated with the Thing and added at the end of this sketch.
*/

#include "thingProperties.h"

void setup() {
  // Initialize serial and wait for port to open:
  Serial.begin(9600);
  // This delay gives the chance to wait for a Serial Monitor without blocking if none is found
  delay(1500);

  // Defined in thingProperties.h
  initProperties();

  // Connect to Arduino IoT Cloud
  ArduinoCloud.begin(ArduinoIoTPreferredConnection);

  /*
     The following function allows you to obtain more information
     related to the state of network and IoT Cloud connection and errors
     the higher number the more granular information you’ll get.
     The default is 0 (only errors).
     Maximum is 4
 */
  setDebugMessageLevel(2);
  ArduinoCloud.printDebugInfo();
}

void loop() {
  ArduinoCloud.update();
  // Your code here


}

/*
  Since RedLed is READ_WRITE variable, onRedLedChange() is
  executed every time a new value is received from IoT Cloud.
*/
void onRedLedChange()  {
  // Add your code here to act upon RedLed change
}
Listing 3
Weather station prototype sketch to update humidity, temperature based on DHT11 readings and turn the red LED and off based on the state of the red_led variable.
Open to view/copy code
// DHT sensor library - Version: Latest
#include <DHT.h>
#include <DHT_U.h>
#include "thingProperties.h"

const int ALERT_LED = 8;      // the number of the LED pin

#define DHTPIN 2
#define DHTTYPE DHT11

DHT dht(DHTPIN, DHTTYPE);

void setup() {
  pinMode(LED_BUILTIN, OUTPUT);
  pinMode(ALERT_LED, OUTPUT);

  // initialize the DHT sensor
  dht.begin();

  // Initialize serial and wait for port to open:
  Serial.begin(9600);
  // This delay gives the chance to wait for a Serial Monitor
  delay(1500);

  // Defined in thingProperties.h
  initProperties();

  // Connect to Arduino IoT Cloud
  ArduinoCloud.begin(ArduinoIoTPreferredConnection);

  /*
     The following function allows you to obtain more information
     related to the state of network and IoT Cloud connection and errors
     the higher number the more granular information you’ll get.
     The default is 0 (only errors).
     Maximum is 4
 */
  setDebugMessageLevel(2);
  ArduinoCloud.printDebugInfo();
}

void loop() {
  ArduinoCloud.update();
  // Your code here
  delay(2000);

  // Reading temperature or humidity takes about 250 milliseconds!
  // Sensor readings may also be up to 2 seconds 'old'
  // (its a very slow sensor)
  float h = dht.readHumidity();

  // Read temperature as Celsius (the default)
  float t = dht.readTemperature();

  // Read temperature as Fahrenheit (isFahrenheit = true)
  float f = dht.readTemperature(true);

  // Check if any reads failed and exit early (to try again).
  if (isnan(h) || isnan(t) || isnan(f)) {
    Serial.println(F("Failed to read from DHT sensor!"));
    return;
  }

  // Compute heat index in Fahrenheit (the default)
  float hif = dht.computeHeatIndex(f, h);
  // Compute heat index in Celsius (isFahreheit = false)
  float hic = dht.computeHeatIndex(t, h, false);

  temperature = t;
  humidity = h;

  Serial.print(F("Humidity: "));
  Serial.print(h);
  Serial.print(F("%  Temperature: "));
  Serial.print(t);
  Serial.print(F("°C "));
  Serial.print(f);
  Serial.print(F("°F  Heat index: "));
  Serial.print(hic);
  Serial.print(F("°C "));
  Serial.print(hif);
  Serial.println(F("°F"));
}

/*
  Since RedLed is READ_WRITE variable, onRedLedChange() is
  executed every time a new value is received from IoT Cloud.
*/
void onRedLedChange()  {
  // Add your code here to act upon RedLed change
  if (red_led) {
    Serial.println("red_led on");
    digitalWrite(ALERT_LED, HIGH);
  } else {
    Serial.println("red_led off");
    digitalWrite(ALERT_LED, LOW);
  }
}
Listing 4
Node-RED Flow to display temperature, humidity using data viewer nodes and control the red LED using inject nodes.
Listing 5
Flow to light the red LED when the temperature rises above 20 degrees.
[
    {
        "id": "93e44a06.81f868",
        "type": "property in",
        "z": "a8d29cdf.fe1dd",
        "connection": "f4c46bfe.1d2748",
        "thing": "bd56b98b-2b40-4787-aa3e-da76eb100cf9",
        "property": "920f2567-7df8-408a-9c93-814d76d34b35",
        "name": "temperature",
        "propname": "temperature",
        "defaultname": true,
        "variableName": "temperature",
        "x": 130,
        "y": 160,
        "wires": [
            [
                "86194a5b.fc3188",
                "b5175095.a84f5"
            ]
        ]
    },
    {
        "id": "86194a5b.fc3188",
        "type": "function",
        "z": "a8d29cdf.fe1dd",
        "name": "",
        "func": "if (msg.payload > 20) {\n    msg.payload = true;\n} else {\n    msg.payload = false;\n}\nreturn msg;\n",
        "outputs": 1,
        "noerr": 0,
        "initialize": "",
        "finalize": "",
        "x": 340,
        "y": 160,
        "wires": [
            [
                "f658a4f6.4d72f8"
            ]
        ]
    },
    {
        "id": "b5175095.a84f5",
        "type": "data-view",
        "z": "a8d29cdf.fe1dd",
        "name": "",
        "property": "payload",
        "fieldType": "msg",
        "width": 200,
        "height": 160,
        "points": 10,
        "active": true,
        "passthru": false,
        "hide": true,
        "outputs": 0,
        "x": 330,
        "y": 240,
        "wires": []
    },
    {
        "id": "f658a4f6.4d72f8",
        "type": "property out",
        "z": "a8d29cdf.fe1dd",
        "connection": "f4c46bfe.1d2748",
        "thing": "bd56b98b-2b40-4787-aa3e-da76eb100cf9",
        "property": "08ef1d84-3d38-4541-bcf8-7155540f841d",
        "name": "red_led",
        "propname": "red_led",
        "defaultname": true,
        "x": 540,
        "y": 160,
        "wires": []
    },
    {
        "id": "f4c46bfe.1d2748",
        "type": "arduino-connection",
        "applicationname": "IoT Cloud"
    }
]
Listing 6
Flow that sends notifications when the threshold rises above 20 degrees.
Note that you are limited to only 500 notifications per month, so do not leave this flow running too long!
[
    {
        "id": "93e44a06.81f868",
        "type": "property in",
        "z": "a8d29cdf.fe1dd",
        "connection": "f4c46bfe.1d2748",
        "thing": "bd56b98b-2b40-4787-aa3e-da76eb100cf9",
        "property": "920f2567-7df8-408a-9c93-814d76d34b35",
        "name": "temperature",
        "propname": "temperature",
        "defaultname": true,
        "variableName": "temperature",
        "x": 110,
        "y": 140,
        "wires": [
            [
                "86194a5b.fc3188",
                "b5175095.a84f5"
            ]
        ]
    },
    {
        "id": "86194a5b.fc3188",
        "type": "function",
        "z": "a8d29cdf.fe1dd",
        "name": "test temperature",
        "func": "if (msg.payload > 20) {\n    msg.payload = true;\n} else {\n    msg.payload = false;\n}\nreturn msg;\n",
        "outputs": 1,
        "noerr": 0,
        "initialize": "",
        "finalize": "",
        "x": 340,
        "y": 140,
        "wires": [
            [
                "f658a4f6.4d72f8",
                "1c64469f.67b679"
            ]
        ]
    },
    {
        "id": "b5175095.a84f5",
        "type": "data-view",
        "z": "a8d29cdf.fe1dd",
        "name": "",
        "property": "payload",
        "fieldType": "msg",
        "width": 200,
        "height": 160,
        "points": 10,
        "active": true,
        "passthru": false,
        "hide": true,
        "outputs": 0,
        "x": 330,
        "y": 240,
        "wires": []
    },
    {
        "id": "f658a4f6.4d72f8",
        "type": "property out",
        "z": "a8d29cdf.fe1dd",
        "connection": "f4c46bfe.1d2748",
        "thing": "bd56b98b-2b40-4787-aa3e-da76eb100cf9",
        "property": "08ef1d84-3d38-4541-bcf8-7155540f841d",
        "name": "red_led",
        "propname": "red_led",
        "defaultname": true,
        "x": 560,
        "y": 100,
        "wires": []
    },
    {
        "id": "432d96f7.6fb348",
        "type": "pushbullet",
        "z": "a8d29cdf.fe1dd",
        "config": "6af4f9cc.950b08",
        "pushtype": "note",
        "title": "",
        "chan": "",
        "name": "",
        "x": 690,
        "y": 280,
        "wires": []
    },
    {
        "id": "1c64469f.67b679",
        "type": "function",
        "z": "a8d29cdf.fe1dd",
        "name": "send notification message",
        "func": "let notificationSent = context.get(\"notificationSent\");\n\nif (msg.payload) {\n    if (!notificationSent) {\n        msg.payload = \"Temperature is too high!\"\n        context.set(\"notificationSent\", true);\n        return msg;   \n    }\n} else {\n    context.set(\"notificationSent\", false);\n}\n",
        "outputs": 1,
        "noerr": 0,
        "initialize": "if (context.get(\"notificationSent\") === undefined) {\n    context.set(\"notificationSent\", false);\n}\n",
        "finalize": "",
        "x": 580,
        "y": 180,
        "wires": [
            [
                "432d96f7.6fb348"
            ]
        ]
    },
    {
        "id": "f4c46bfe.1d2748",
        "type": "arduino-connection",
        "applicationname": "IoT Cloud"
    },
    {
        "id": "6af4f9cc.950b08",
        "type": "pushbullet-config",
        "name": "Mike Pushbullet"
    }
]
Node-RED: Lecture 6 – Example 6.3 Using context to generate rolling averages
A special module called context, used to store data between function invocations, is available to function nodes. This can be useful when the function needs to retain state to do its processing. For example, in a typical Industrial IoT scenario, Continue reading “Node-RED: Lecture 6 – Example 6.3 Using context to generate rolling averages”
Smart City standards: an overview
Making sense of Smart City standardization activities
Update: For a fuller discussion of Smart City technologies, including standards, read Smart City Technology Trends
Last year I was asked to write an article on Smart City standards for the IEEE standards magazine. This blog post was the basis for that article, but also acts as an evolving document as I update it as standards activities evolve.
First step – get some sort of framework to understand where different standards fit
The amount of activity in Smart City standardization is truly overwhelming – this is partly due to the breadth and scope of Smart City activities – from water pipes to people – and partly because it is early in the process and the standards bodies are still trying to understand how best to contribute.
After spending several days drowning in standards, I decided to step back and try and find a way of categorizing the different standards. I came across a useful framework from the UK’s standards body, the British Standards Institute (BSI), which is part of an excellent (and free) report they’ve written on Smart Cities (PD 8100 Smart city overview)
The Framework categorizes standards into 3 main levels, Strategic, Process and Technical
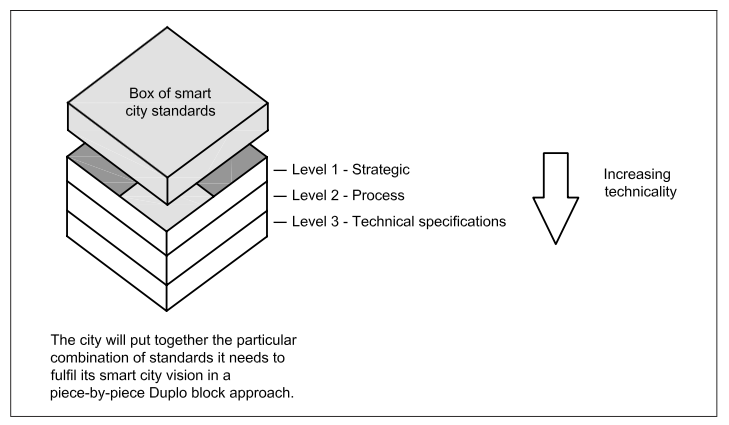
- Level 1: Strategic: These are smart city standards that aim to provide guidance to city leadership and other bodies on the “process of developing a clear and effective overall smart city strategy”. They include guidance in identifying priorities, how to develop a roadmap for implementation and how to effectively monitor and evaluate progress along the roadmap.
- Level 2: Process: Standards in this category are focused on procuring and managing smart city projects – in particular those that cross both organizations and sectors. These essentially offer best practices and associated guidelines.
- Level 3: Technical: This level covers the myriad technical specifications that are needed to actually implement Smart City products and services so that they meet the overall objectives
As the BSI state: “Strategic-level standards are of most relevance to city leadership and process-level standards to people in management posts. However, even technical specifications are relevant to people in management posts as they need to know which standards they need to refer to when procuring technical products and services.”
Using the Framework to position and group standards activities
Once we have a usable framework, the process of trying to fit standards into the levels can begin. The BSI folks have made a useful start – highlighting a number of ongoing international activities that they, as the UK’s standards body, collaborate on – and placing them in the framework.
The main international bodies are:
- ISO: International Organization for Standards . The main global body that national standards bodies work with and with which many of us are familiar with via “ISO certified”
- CEN/CENELEC/ETSI: In Europe, standards are developed and agreed by the three officially recognized European Standardization Organisations: the European Committee for Standardization (CEN), the European Committee for Electrotechnical Standardization (CENELEC) and the European Telecommunications Standards Institute (ETSI).
- ITU: ITU is the United Nations specialized agency for information and communication technologies – ICTs
- IEC: Founded in 1906, the IEC (International Electrotechnical Commission) is the world’s leading organization for the preparation and publication of International Standards for all electrical, electronic and related technologies. These are known collectively as “electrotechnology”.
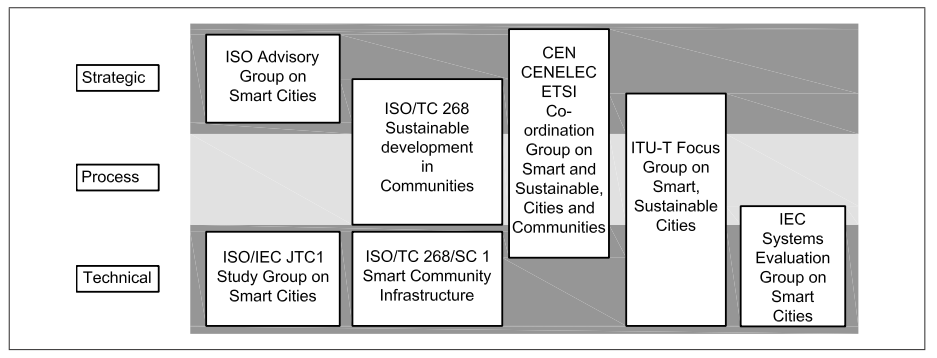
Placing major worldwide standards activities in BSI framework (Copyright BSI 2015)
It’s still a fairly daunting set of activities, but at least we now have a sense of where the major international standards groups are focused and we can begin to take a look at some of the more important activities. In the next section, I highlight a few activities that I’ve come across that I think are important and seem to have significant momentum. If you are looking for a more comprehensive list, then in the final section, I’ve listed up all the activities I’ve come across.
Note, most actual standards documents are expensive – unless you are a member of the standards body – so a casual browse isn’t an option. I’ve linked to official documents and summaries below and if I’ve come across a publicly accessible overview, I’ve added that – if you know of better public information, let me know.
If you are working on Smart Cities today – here’s some standards activities you should at least be aware of
STRATEGIC – AIMED AT THE PROCESS OF DEVELOPING A CLEAR AND EFFECTIVE OVERALL SMART CITY STRATEGY
- ISO 37120 Sustainable development of communities — Indicators for city services and quality of life. This standard, part of a suite by ISO’s Technical Committee 268 identifies 100 indicators that cities should track to allow them to benchmark progress. Actually there are 17 areas, 46 core and 54 supporting indicators that cities either “shall” (core) or “should” (supporting) track and report. The World Council on City Data (WCCD) has been set up by cities to benchmark cities and has certified 17 global cities. Worth taking a look.
- From the BSI, BS 8904 has a focus on sustainable communities and “provides a framework as recommendations and guidance that assist communities to improve. The recommendations and guidance are intended to be applied by communities of any size, structure and type.”
- Two draft ISO standards also looking at sustainable communities are ISO 37101: Sustainable development & resilience of communities – Management systems – General principles & requirements and ISO 37102: Sustainable development & resilience of communities – Vocabulary. An overview of this ongoing work is here
PROCESS – PROCURING AND MANAGING SMART CITY PROJECTS
- The development by the BIS of a Smart city framework standard (PAS 181) falls into the Process category: “It provides practical, ‘how-to’ advice, reflecting current good practice as identified by a broad range of public, private and voluntary sector practitioners engaged in facilitating UK smart cities”
- The development of a Data concept model for smart cities (PAS 182). This is probably worth a look at if you are interested in data hubs and data interoperability issues as it bases some of its work on the UK’s HyperCat IoT interoperability standard.
TECHNICAL – IMPLEMENTING SMART CITY PROJECTS
- Two technical standards that are still under development, (from the ISO/IEC JTC1 group) but worth tracking are ISO/IEC AWI 30145 Information technology – Smart city ICT reference framework and the associated ISO/IEC AWI 30146 Information technology – Smart city ICT indicators which are both looking at the ICT infrastructure needed for Smart Cities. Need a publicly available overview for these. Draft versions of these documents are available here
- ISO: Report from JTC1 – looking at ICT for smart cities: A 2014 document that lays out the Smart City space from a technical point of view. There’s a useful diagram (fig 4) that highlights the technical areas that ISO, IEC and ITU are working on as well as details of their standards work and of the overall activities of JTC1 – great info but heavy going.
- IEEE P2413 (http://standards.ieee.org/develop/project/2413.html) is a developing standard from the Institute of Electrical and Electronic Engineers (IEEE) for an architectural framework for the Internet of Things (IoT). The standard is being designed, when completed, to offer a reference model defining relationships among various IoT verticals such as transportation and healthcare (the same verticals that are being transformed in the world’s transition to smart cities) and their common architecture elements.
It’s also worth taking a look at the full set of BSI standards for Smart Cities. Although these are national standards, the UK seems to have developed a comprehensive set of Smart City activities quite early and they appear to be feeding in to ongoing international organizations.
- The development of a standard on Smart city terminology (PAS 180)
- The development of a Smart city framework standard (PAS 181)
- The development of a Data concept model for smart cities (PAS 182)
- A Smart city overview document (PD 8100)
- A Smart city planning guidelines document (PD 8101)
- Mapping research and modelling for Smart Cities
- Guidance on the Economic Assessment and Funding of Smart City Initiatives
A somewhat more nascent effort by the US National Institute of Standards (NIST) can be found here – this seems to be more of a ‘call to action’ than actual NIST endorsed standards, but worth taking a look at if you are USA based.
A more comprehensive list of the standards activities in the various International groups
Don’t read any further if you are already feeling overwhelmed – but for those who care (or just like this stuff) here’s a more comprehensive list of standards I’ve come across – returning to the BSI framework:
Placing major worldwide standards activities in BSI framework (Copyright BSI 2015)
ISO activities
- ISO 37120: Sustainable development & resilience of communities – Indicators for city services & quality of life
- ISO/TR 37150: Smart community infrastructures – Review of existing activities relevant to metrics
- ISO 37101: Sustainable development & resilience of communities – Management systems – General principles & requirements
- ISO 37102: Sustainable development & resilience of communities – Vocabulary
- ISO/TR 37121: Inventory & review of existing indicators on sustainable development & resilience in cities
- ISO/TS 37151: Smart community infrastructure metrics – General principles & requirements 7.
- ISO/TR 37152: Smart community infrastructures — Common framework for development & operation
- A useful slide deck describing activities of ISO JTC1 – Working group on Smart Cities (WG 11) is here
IEC activities
- IEC/SEG 1: Systems Evaluation Group on Smart Cities – Most of their activities seem to be working group reports, a list that reference ‘Smart Cities’ can be found here
ITU activities
- ITU-T SG5 FG-SSC: Focus group on smart sustainable cities
- SSC-0100-Rev 2: Smart Sustainable cities – Analysis of Definitions
- SSC-0110: Technical Report on Standardization Activities and Gaps for SSC and suggestion to SG5, ITU-T
- SSC 162: Key performance indicators (KPIs) definitions for smart sustainable cities
CEN-CENELE-ETSI (aka European) activities
- CEN-CENELEC-ETSI SSCC-CG: Smart and Sustainable Cities and Communities Coordination Group
Related Standards
While not directly related to Smart Cities, the following technical standards will play a part because they focus on constituent parts of the smart city:
- General – IEEE has a document that lists up their standards that they think are related to Smart Cities – available here.
- Security
- The National Institute of Standards and Technology (NIST) released a preliminary discussion draft of its Framework for Cyber-Physical Systems. The draft has an ambitious goal: to create an integrated framework of standards that will form the blueprint for the creation of a massive interoperable network of cyber-physical systems (CPS), also known as the “Internet of Things.” In 2014, NIST established the cyber-physical systems public working group(CPS PWG)—an open public forum.
Updates
You may be interested in my article on Technology Trends affecting Smart Cities which includes a discussion of Smart City Standards.
This blog has been turned into an article for the IEEE standards online Magazine, read it here