For our final example of building Dashboards and UIs we’ll use a generic technique we’ve experimented with before. That’s the web service approach that uses a http node to allow us to accept http requests and return web pages. We used this approach in example 1.3 but didn’t explain the details.
Sticking with the openweathermap node, let’s use it to generate a simple JSON structure that we then visualize using the popular Morris.JS chart library (). The library supports 4 basic chart types line charts, area charts, bar charts and the donut chart. We’ll be using the donut chart but the approach is the same for all the chart types.
The flow is shown below and consists of 4 nodes. The first and final nodes are http input and output nodes that work together to listen for HTTP requests and send HTTP responses. This flow listens for a HTTP request from any source, but let’s assume a regular browser here. When it arrives, it queries the weather using your openweathermap node, then uses a template node to build a HTTP page using the weather data, and passes that to the http output node which sends back the webpage to the browser.
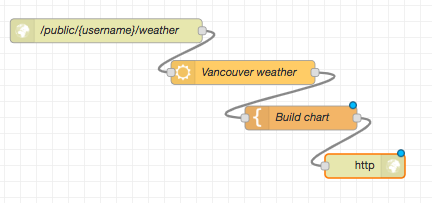
Figure. A simple web server example to graph weather data using a pi chart
Double click on the http input node and configure it with your URL, e.g. /public/weather. Remember, to access it, you will need to use,
https://{user name}.fred.sensetecnic.com/api/public/weather
where {user name} is replaced by your own FRED user name. Obviously /weather is because that’s how you configured it, if you’d used another name, e.g. /public/test, then the URL would end /public/test
When a HTTP request comes in, the http input node creates a message to trigger the openweathermap node, which is the next node in the flow. The openweather node gets the current statistics for the location you configured it for, and then passes those statistics, as a JSON structure in the usual message payload field, to a template node. The html template node is another pre-built node in Node-RED, which, like the function node, allows you to build arbitrary code. However, rather than using JavaScript like the function node, the template node works with text such as HTML.
The HTML code in the template node is shown in the listing below. As you can see, the code is a standard HTML structure with the <head> structure defining the external script libraries that we use. These are all required for the Morris.JS chart library and should be copied exactly.
Note, we are combining all the page elements into the one file (or node) which works for simple web pages but is not considered good practice.
Line 10 sets up a <div> and sets the name and height. Then the morris.js chart code script begins at line 11 by defining a Morris.Donut element.
Listing A simple HTML template to display a donut chart of calorie usage
- <!doctype html>
- <head>
- <title>A Node RED Example</title>
- <link rel=”stylesheet” href=”//cdnjs.cloudflare.com/ajax/libs/morris.js/0.5.1/morris.css”>
- <script src=”//cdnjs.cloudflare.com/ajax/libs/raphael/2.1.0/raphael-min.js”></script>
- <script src=”//ajax.googleapis.com/ajax/libs/jquery/1.9.0/jquery.min.js”></script>
- <script src=”//cdnjs.cloudflare.com/ajax/libs/morris.js/0.5.1/morris.min.js”></script>
- </head>
- <html>
- <div id=”chart-example” style=”height: 250px;”></div>
- <script>
- Morris.Donut({
- element: ‘chart-example’,
- data: [
- {label: “Temperature (Celcius)”, value: {{payload.tempc}} },
- {label: “Humidity”, value: {{payload.humidity}} },
- {label: “Wind Speed (knts)”, value: {{payload.windspeed}} }
- ]
- });
- </script>
- </html>
Lines 15, 16 and 17 define the donut elements, you are using 3 to display the temperature, the humidity and the wind speed. The values from the openweathermap JSON structure can be used directly, i.e. payload.tempc, payload.humidity and payload.windspeed.
Once the template node has generated the HTML file, it passes it as a message to the final node, which is a http response node. This node packages up the HTML as a HTTP response which it sends back to the browser that made the original request.
If you deploy this flow and then point your browser to the URL you configured in the http input node, in your case should be:
https://{user name}.fred.sensetecnic.com/api/public/weather
You will then see a simple donut chart which you can mouse over to see the temperature, humidity and windspeed for the city you configured in the openweathermap node – all built and served by a simple Node-RED flow!
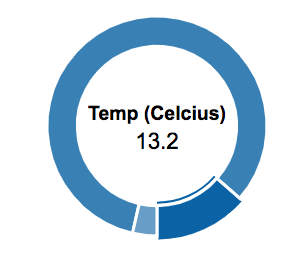
Figure: A donut chart, served up by Node-RED showing Temperature for the configured city
Summary
In this lecture you have looked at three approaches to building simple dashboards and UIs. The FreeBoard node is a one stop shop allowing you to feed complex data as JSON structures to the Freeboard node and then using the powerful FreeBoard dashboard to configure and show the data.
With the nodered.contrib.ui nodes you have to do a little more work by having to build the UI elements into your flows. This approach gives you more control, and makes the UI elements part of your Node-RED flow, but requires a little more thought and work.
The final approach, using the html template node and a generic JavaScript charting library is the most flexible, but requires you know how to write simple html/css and JavaScript.
Part 1 Part 2
About Sense Tecnic: Sense Tecnic Systems Inc have been building IoT applications and services since 2010. We provide these lectures and FRED, cloud hosted Node-RED as a service to the community. We also offer a commercial version to our customers, as well as professional services. Learn more.
© Lea, Blackstock, Calderon

This work is licensed under a Creative Commons Attribution-NonCommercial 4.0 International License.