Example 2.2 A second flow: weather alerts
In this example, which is similar to the one introduced in lecture 1, you’ll monitor the weather in your hometown and send yourself an email when the weather looks like it’s going to be good. You’ll use a weather node – openweathermap – that retrieves the weather from openweathermap.org for the location you set it for. A simple function node will be used to check for ‘clear weather’ and an Email node will be used to send yourself am email when the weather looks good. Essentially, weather monitoring with Node-RED!
If you are running Node-RED on a Pi or desktop computer, nodes are managed through the Node-RED palette manager available in the Node-RED menu in the top right. Select Manage palette, then Install. From there you can search for “openweathermap” and click the Install button. Once installed, you will see two nodes in the left node palette, added into their own grouping of ‘weather’.
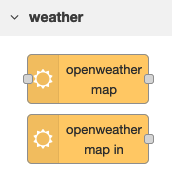
We will be using the second, “openweathermap in” – this node periodically polls the OpenWeatherMap service and generates a message when anything changes. The other node requires an explicit trigger.
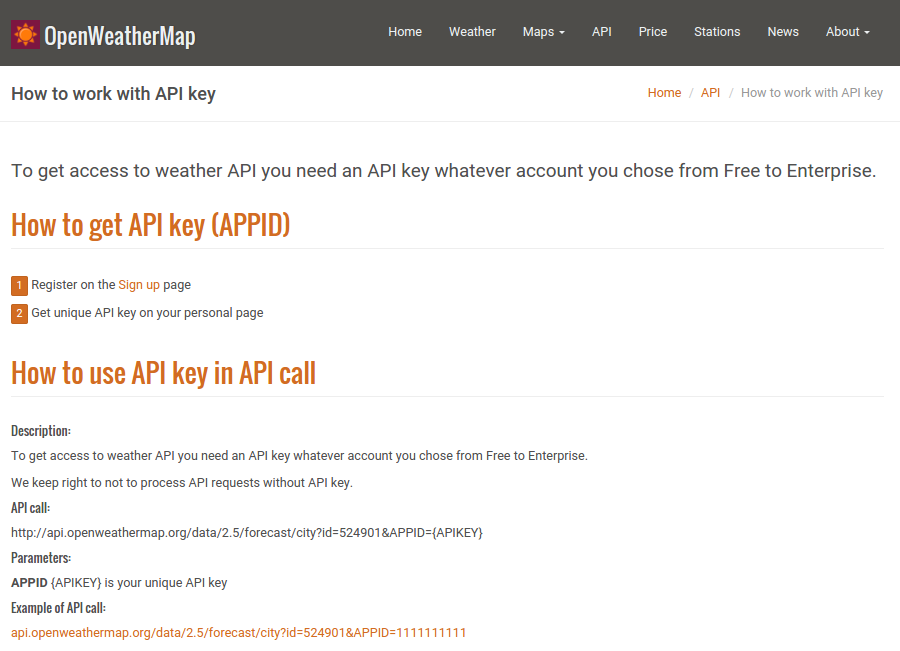
First you will need to get an API key at OpenWeatherMap. OpenWeatherMap offers a great service that provides detailed weather information for worldwide locations. Visit http://openweathermap.org/appid and follow the instructions as shown in the screenshots below.
You will need to sign up for an OpenWeatherAccount as shown below:

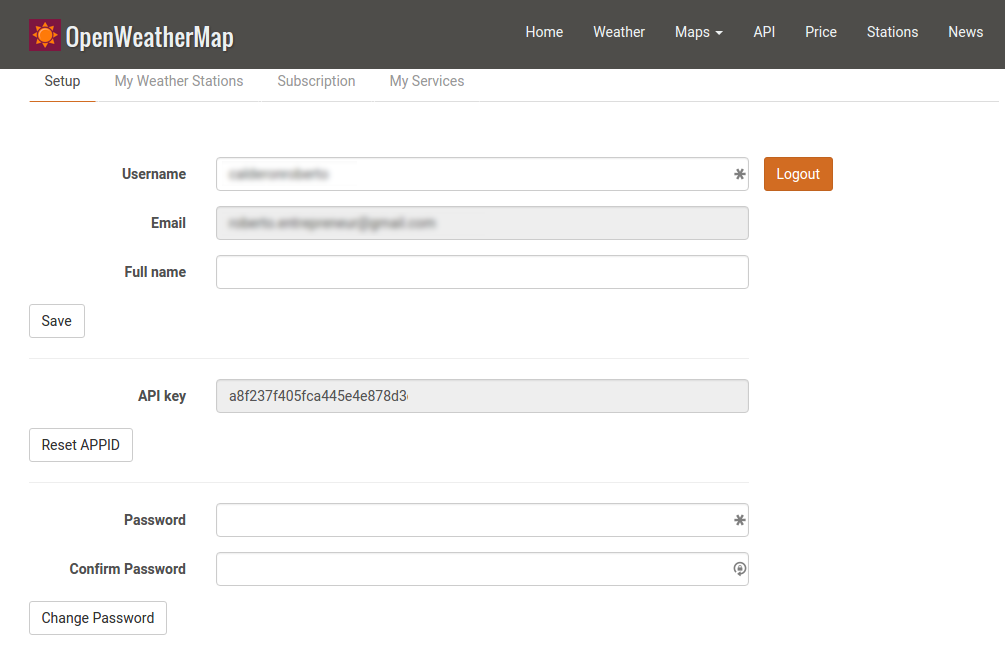
After signing up you will be redirected to your Home page where you will be able to access or re-generate your API Key. It should look something like this:
Now, let’s use that API key to build a weather alerts flow. Drag and drop a weather node from the left pane onto the workspace, as shown in Figure 2.11.
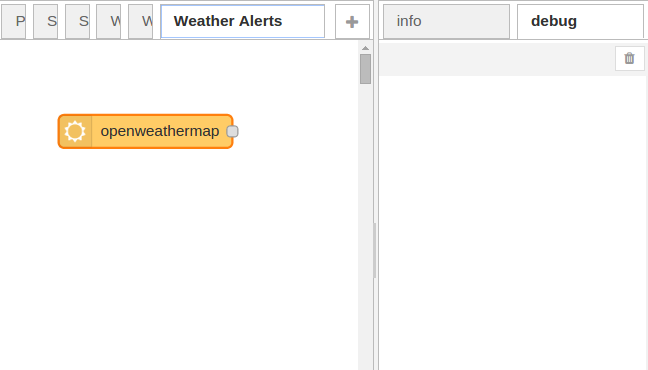
Figure 2.11. Drag and drop a weather node onto a blank workspace.
If you select the help pane on the right, you can see a description of the openweathermap node with detailed information on how to configure and use it. Some interesting things to note:
- It has a full JSON structure as its msg.payload, with quite a lot of weather detail, all presented as name:value pairs, e.g. wind speed and tempc
- The node defines 3 new message properties, msg.location, msg.time and msg.data. As mentioned previously (L2 Part 1) , you are free to add properties to messages, and the openweathermap node has added these new properties to carry extra information associated with the message.
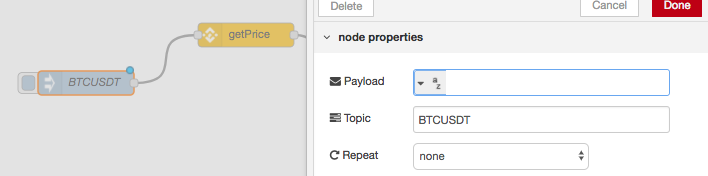
Let’s configure the node and look at the actual data structure it generates after it has queried your local weather. Start by double-clicking on the node and fill out the form with your API key you copied from the openweather website. Type your city and country in the fields, leave the “Current Weather for” field selected and click on “Done” as shown in Fig. 2.12.
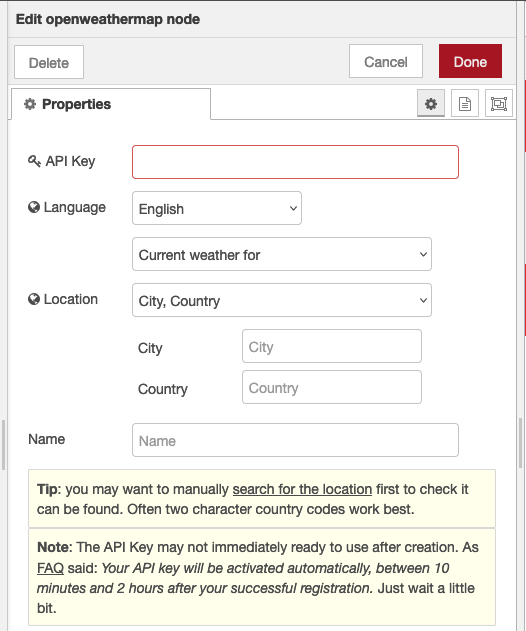
Figure 2.12. Set your city and country in the configuration form, use the API key you obtained in the step above.
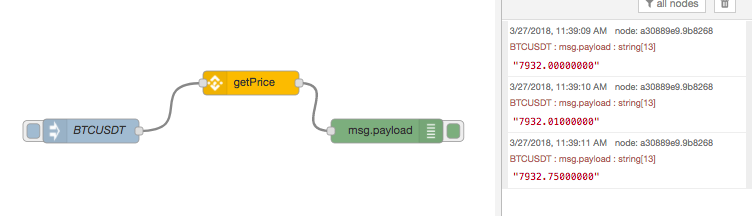
Then drag and drop a debug node and wire it to the openweathermap node. Click on “Deploy” to see that the payload object from the openweathermap node in the debug pane. If you get an error message in the debug pane saying “invalid API key provided” make sure you have copied and pasted the API key correctly. Also note that the API key sometimes take upto 2 hours before it is activated, so you may need to grab a coffee and try later!
Listing 2.3 The message payload for the openweathermap node is a JSON structure describing weather conditions, temperature, wind, cloud cover and sunrise times.
- {
- “weather”: “Clear”,
- “detail”: “sky is clear”,
- “tempk”: 295.104,
- “tempc”: 21.903999999999996,
- “humidity”: 53,
- “maxtemp”: 295.104,
- “mintemp”: 295.104,
- “windspeed”: 2.22,
- “winddirection”: 273.007,
- “location”: “Vancouver”,
- “sunrise”: 1432038196,
- “sunset”: 1432094081,
- “clouds”: 8,
- “description”: “Vancouver weather(49.25,-123.12) is Clear (sky is clear).”
- }
As you can see, the node delivers quite a lot of information about your local weather, all as the usual name:value pairs. For this example, you want to use the “weather” field which you’re going to test to see if it’s reported as “Clear”. If it’s “Clear” you’ll then send a tweet.
To program that logic, you’ll use a function node. You saw one of these in lecture 1, but without the details. Let’s see how they are used by dragging one onto the flow workspace and double clicking it to open up the node editor.

Figure 2.13. Add a function node and wire it to the openweathermap node.
Now double-click on the function node and type/copy this (Note if you use copy/paste – make sure you paste as plain text, wordpress sometimes inserts odd characters)
Listing 2.4 Function node “If Clear Weather”
- if (msg.payload.weather === “Clear”) {
- msg.payload = “Clear skies ahead today!”
- return msg;
- }
- return null;
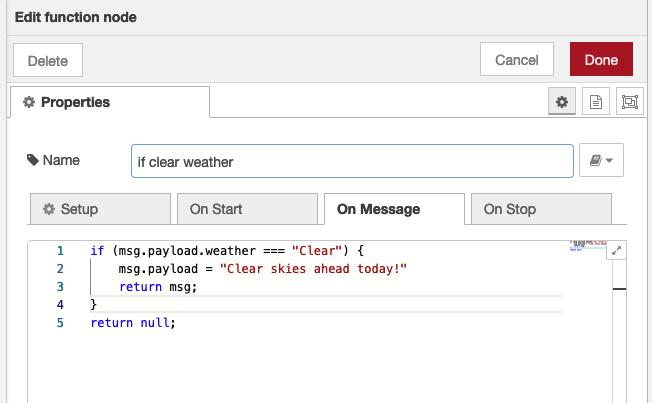
Figure 2.14. Edit the function node adding the JavaScript shown in listing 2.4
Looking at Listing 2.4, you can see that this will parse the incoming message payload for the weather parameter and compare it to the string “Clear” (line 1). If it is equal, it will rewrite the message payload with your own string “Clear skies ahead today!” (line 2). Otherwise it will return a null message (line 5). This last bit is important because in Node-RED nodes ignore null messages.
You can do all sorts of things now, for example wire this message to an email node, or a pushbullet node or the twitter node.
Note, a previous version of this lecture demonstrated how to use the twitter node, however twitter have updated their APIs (2023) and have restricted the access via the free account – so it has become difficult to work with the twitter API using the standard node. We have left instructions for how to configure it at the bottom of this page but can’t guarantee it will work.
As an alternative you can configure a basic email node as follows.
Drag and drop the email out node onto the canvas (you may need to install it first). Double Click to edit it:
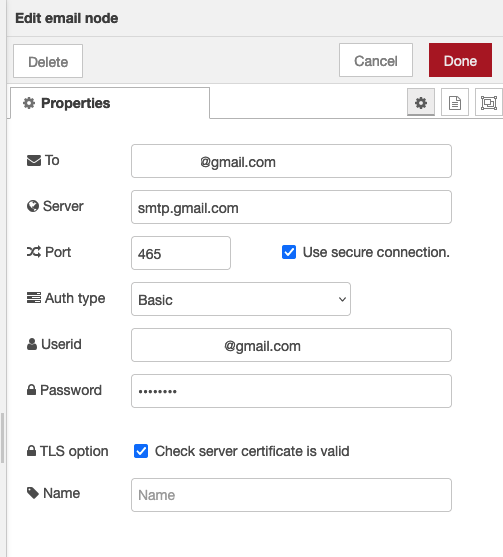
By default, the email node tries to use gmail (smtp.gmail.com). If you want to use another smtp server, then you will need to find the details for its address and port. If you want to use the gmail server then you can use the default smtp server and port but you will need to:
- go to the security settings for your gmail account and
- setup 2 factor authentication on your account
- generate an app key and use it in place of a password
- Note – we suggest you setup a new gmail account for these experiments, you don’t want to make a mistake and have problems with your regular account
Then configure the email node with a recipient in the to field, leave the server, port and auth fields as default. Provide your email account login in Userid and the newly created app key in the Password field.

Once configured, wire the email node to the function key and deploy. If the weather is clear, they you will receive an email from Node-RED!
Importing Nodes and Flows using the clipboard
One of the most useful features of the Node-RED UI is the ability to copy and paste nodes and even full flows using the standard cut’n’paste clipboard. Node-RED flows are simply coded as JSON strings and can be exported from a workspace, and imported into a workspace using the Node-RED pulldown menu in the top right of the Node-RED window.
Rather than building the flows in this example, or in fact anywhere in this lecture series, by hand yourself, you can simply copy them from our website and paste them into a workspace. After that all you need to do is configure them correctly, e.g. with credentials, and deploy them.
Let’s quickly show you how to do that.
Click on the link for this example which is at the end of the example below and look for the JSON code. Copy it to the clipboard using the usual CTL C or copy item in the edit menu.
Using the pulldown menu in the top right of the Node-RED window, select Import as shown in Fig 2.17
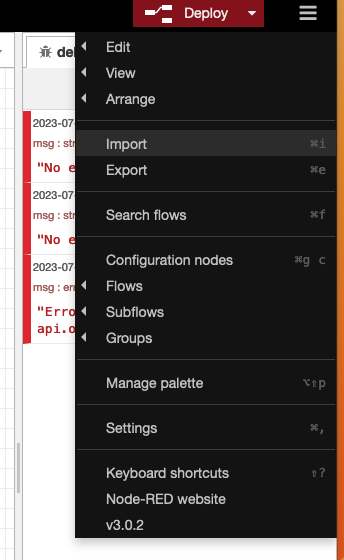
Figure 2.17 Selecting the Import from Clipboard menu item in Node-RED
You will see a popup with an input field (Fig 2.18). Paste your clipboard into the input window and click OK.
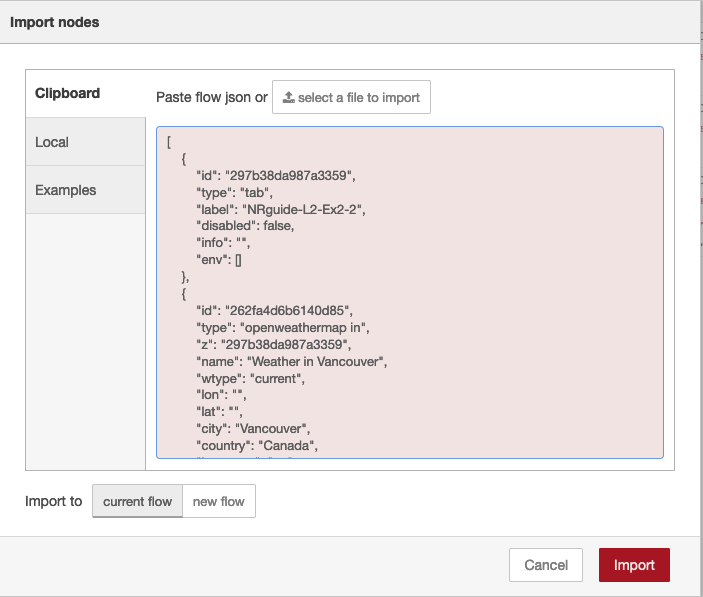
Figure 2.18 Pasting a flow into the import window of Node-RED
The new flow will appear in the current workspace and can be moved to a location and dropped. Once it’s in place, you can configure it as you would a flow you created yourself and deploy it. Try it with this code:
Copy example flow
[{"id":"3b4275ef.c4bd8a","type":"openweathermap in","name":"","lon":"","lat":"","city":"","country":"","x":141.0994415283203,"y":284.0909118652344,"z":"d0851e69.2f7ae","wires":[["b766183d.4899e8"]]},{"id":"b766183d.4899e8","type":"function","name":"","func":"if (msg.payload.weather === \"Clear\") {\n msg.payload = \"Clear skies ahead today!\"\n return msg;\n}\nreturn null;","outputs":1,"noerr":0,"x":268.0994567871094,"y":344.0909118652344,"z":"d0851e69.2f7ae","wires":[["c221838c.3dde8"]]},{"id":"c221838c.3dde8","type":"twitter out","name":"Tweet","x":393.0994415283203,"y":391.0909118652344,"z":"d0851e69.2f7ae","wires":[]}]
Which can also be copied from our github repo: Ex2-2 nrguideflows on github
Summary
In this lecture you have created your first flows and seen how to wire together a set of basic nodes to achieve quite complex tasks. We’ve skipped over a few of the underlying details in order to get you going quickly, and we’ll return to those in lectures 3 and 4. However, so far you’ve seen how to use the Node-RED visual flow builder, the basic classes of input, output and processing nodes. You were given a brief overview of messages and how to use the function node to write your own JavaScript code to do simple processing on messages within a flow. In the next lecture, you’ll take a more in-depth look at the programming model of Node-RED and get a better understanding of the main programming elements and nodes and how to craft more complex flows using a variety of nodes.
Appendix – using the twitter node
As discussed above, as of June 2023, Twitter are going through a lot of internal changes and have changed both their APIs and their business model – so the free account they offer is a little unstable:-) If you want to try the twitter node, follow these instructions but be aware you may get errors.
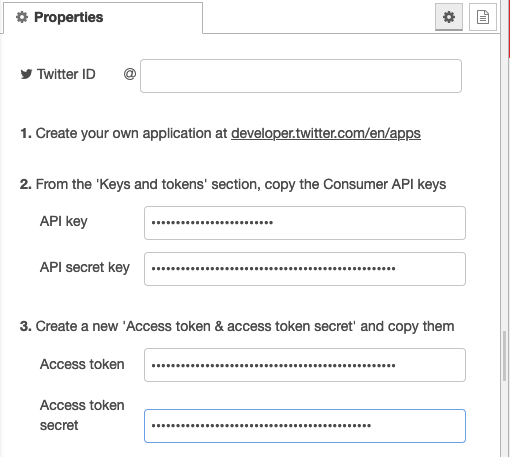
If not already installed, install the twitter node and then drag a Twitter node onto the workspace, double-click and and fill out your Twitter account credentials as shown in Fig 2.15.
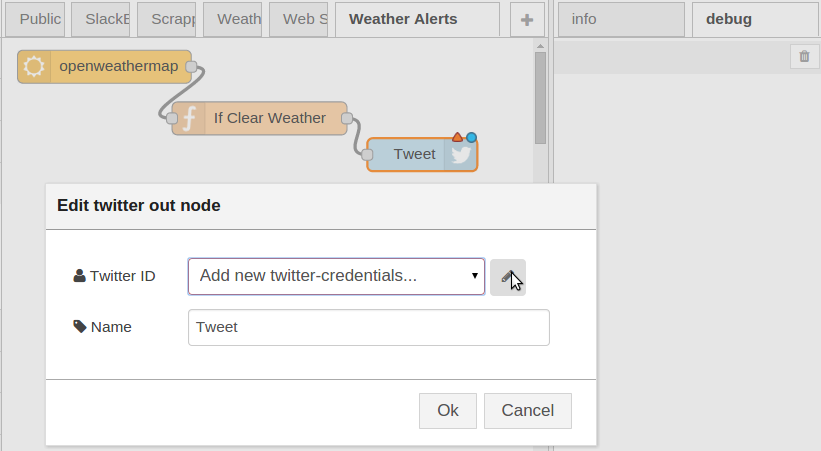
Figure 2.15. Set your Twitter account credentials into the node configuration
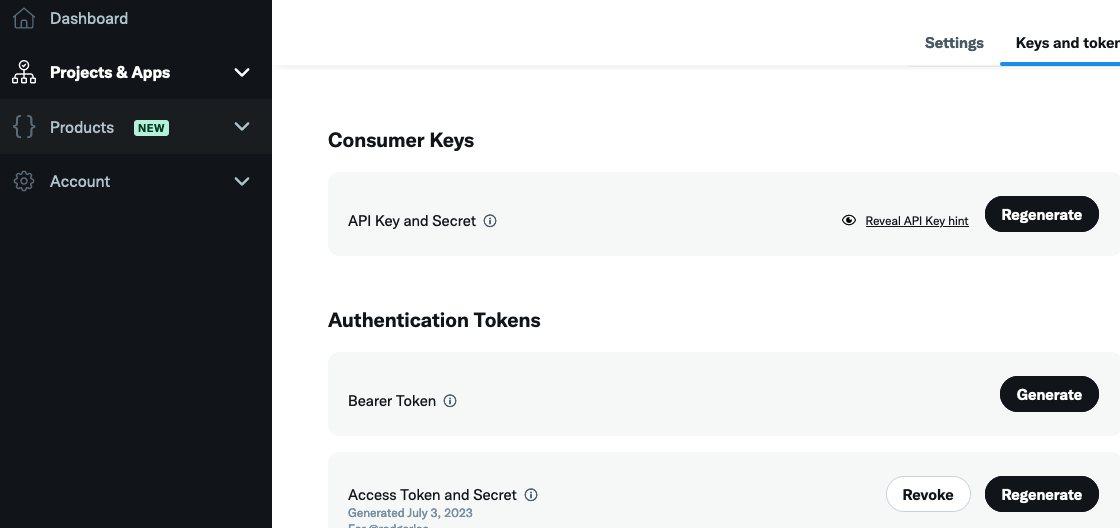
To generate these credentials if you don’t already have them you will need to login to the twitter developer site: developer.twitter.com/en/apps
You will have to create an ‘application’ and give some general details on what your application will be doing – explaining what you are doing with this tutorial is enough. Then select the new application and generate the appropriate keys.
Once created, copy them into the specific fields, add your twitter account name and save the node. Note, you should also save these credentials into a safe place. Node-RED will encrypt these credentials in your local instance, and although you can reuse them whenever you use the twitter node, you will never be able to get back the plain text keys – so store them safely separately.
Once you’ve wired up the flow, you can hit the deploy button and then watch your Twitter account to see the new tweet every time the weather is reported as clear.
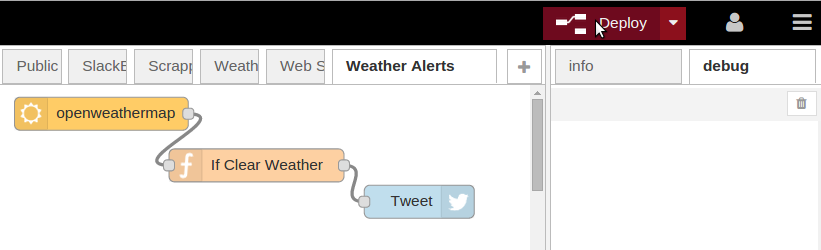
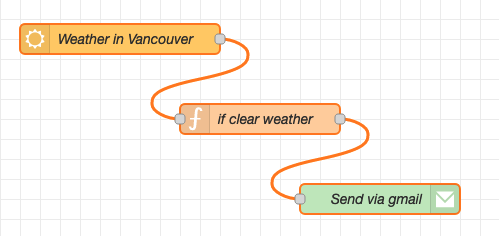
Figure 2.16. The full weather flow sending tweets if the weather report mentions clear skies.