In this lecture you will take a look at a few techniques to allow you to visualize data passing through flows. We’ll focus on three approaches, the use of a third party dashboard tool, FreeBoard (Part 1), using the default Dashboard UI nodes provided by default in Node-RED (Part 2) and a general technique using a standard JavaScript charting tool (Part 3).
By the end of the lecture you will have enough knowledge to decide which approach is best for your specific needs and how to quickly get a visualization of your data up in a web browser.
| We use a cloud hosted version of Node-RED for these lectures called FRED. Sign up for a free account at FRED.sensetecnic.com. Examples in the early lectures will work with other installations of Node-RED, later lectures use nodes you will need to install yourself if you don’t use FRED. |
Example 7.1 Using the FreeBoard dashboarding service
This is a simple example of reading and visualizing data using the FreeBoard node from a Node-RED flow. We’ll be using the Cloud based FRED service as our Node-RED engine and visualizing data from a web weather service . This guide will show you how to:
- set up an openweathermap node in FRED using the built in node
- display the data from the openweathermap node using the FreeBoard display node
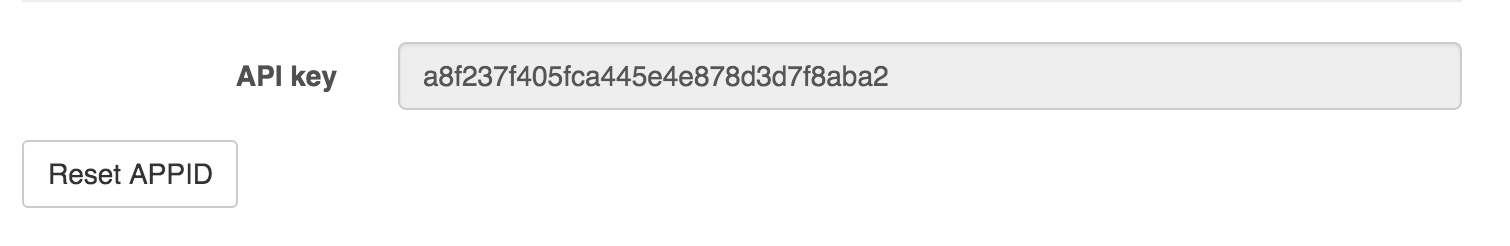
To begin, head over to openweathermap.org and register for a free account. When you register/login you will be able to access your API Key. You will need your own API key which will look similar to the one below – you will use your own key in Node RED so make a copy.
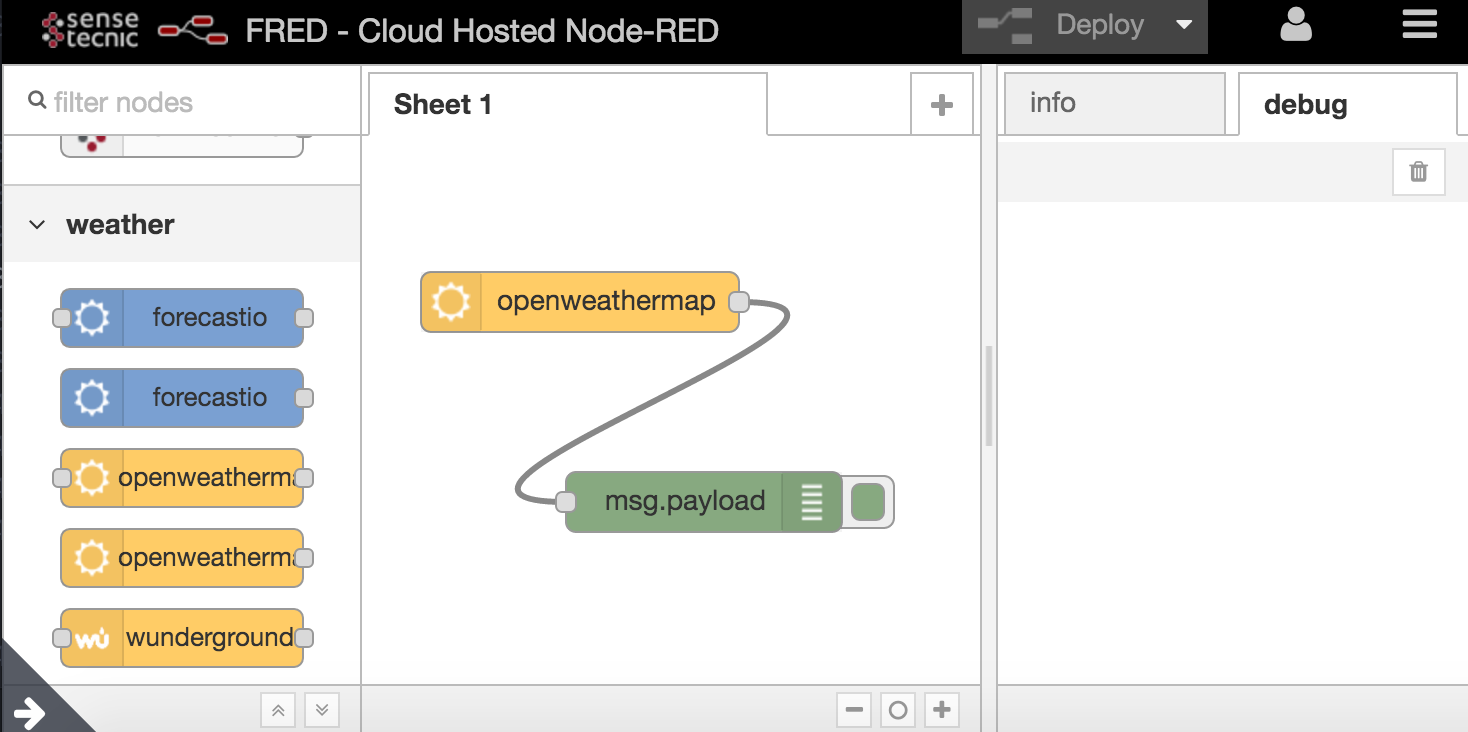
 Now, head over to FRED and create a new flow by starting with an openweathermap node (you will find this node under “weather”, or by using “filter nodes” to search at the top of the left pane) and connecting it to a debug node like this:
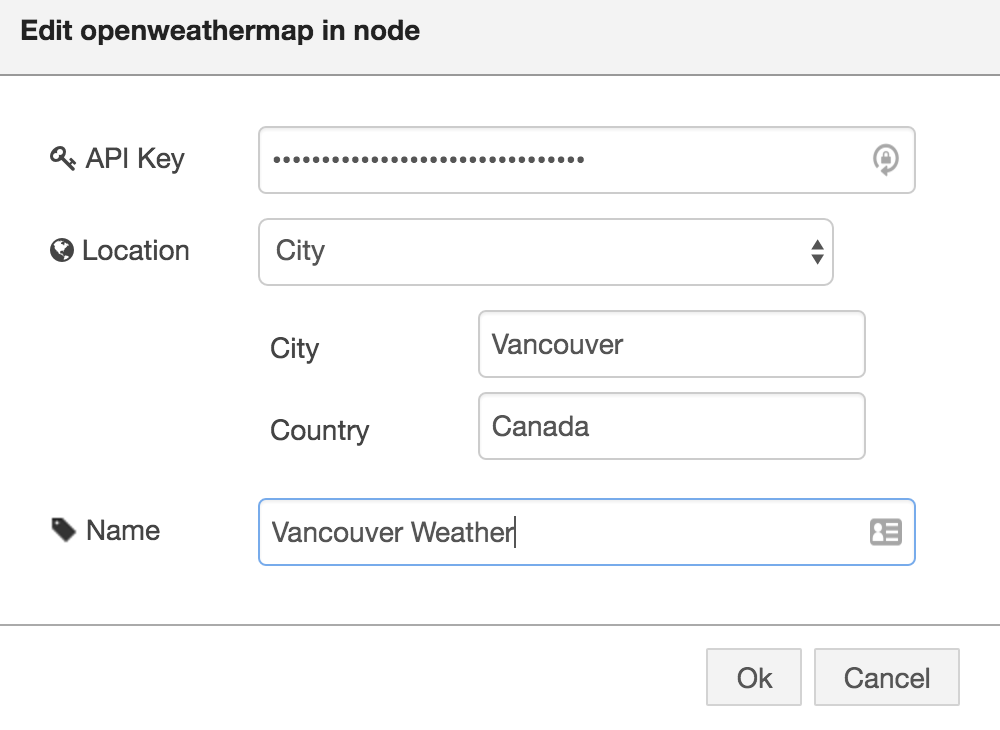
Now, double click on the openweathermap node to configure it. Enter your API Key from OpenWeatherMap, configure a location you’re interested in, and name your Node:
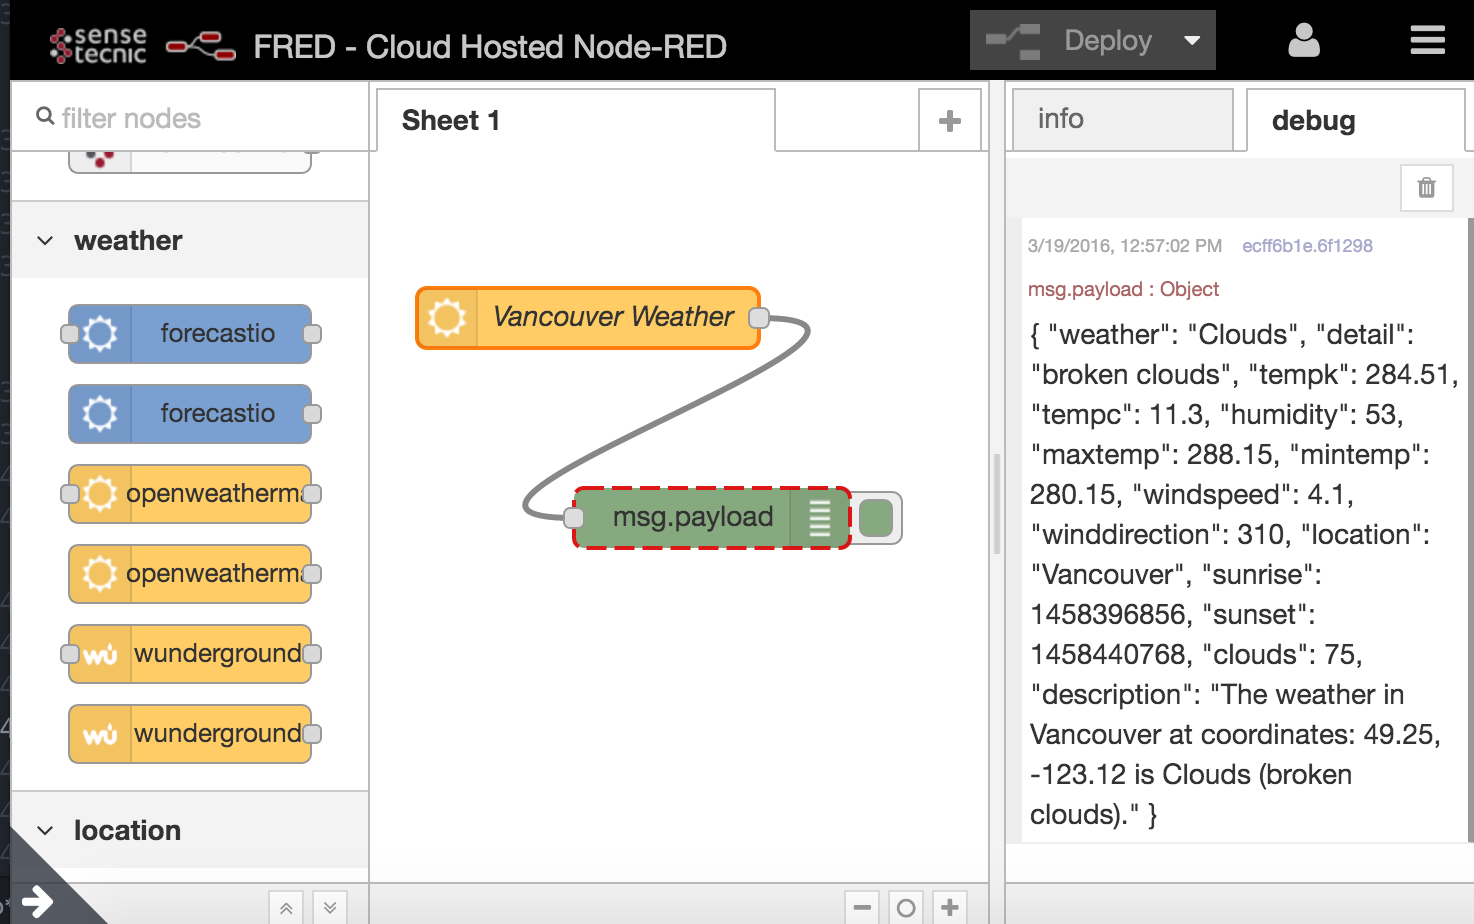
Click on Deploy on the top right corner of the Node-RED UI. You will see on the right pane, under “debug” the data that OpenWeatherMap provides us with a variety of information about the location including temperature (in C and K), humidity, windspeed etc:
As you can see, the data is already in JSON format; so we can use any of the values very easily. Let’s build a dashboard to visualize our data using the node that allows you to create visualizations very easily. Find the freeboard node in the left pane by either browsing through the nodes or searching for it using “filter nodes”. Add it to the flow. Double click on it to give it a name, like so.

Click on Deploy. This will prompt the openweathermap to get data and send it to both the debug and freeboard nodes. The freeboard node is quite smart and will do its best to parse the data you send it and figure out how to make it available using the FreeBoard UI. We’ll look at that in a moment. If you inspect the “info” tab in the right panel you will see more information about the “freeboard” node:
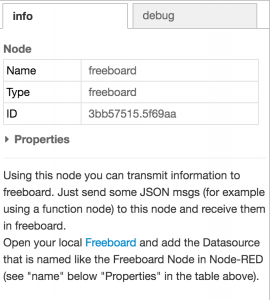
Visit the link provided in the info panel, or at
https://{username}.fred.sensetecnic.com/api/freeboard/
This will open a new tab in your browser:
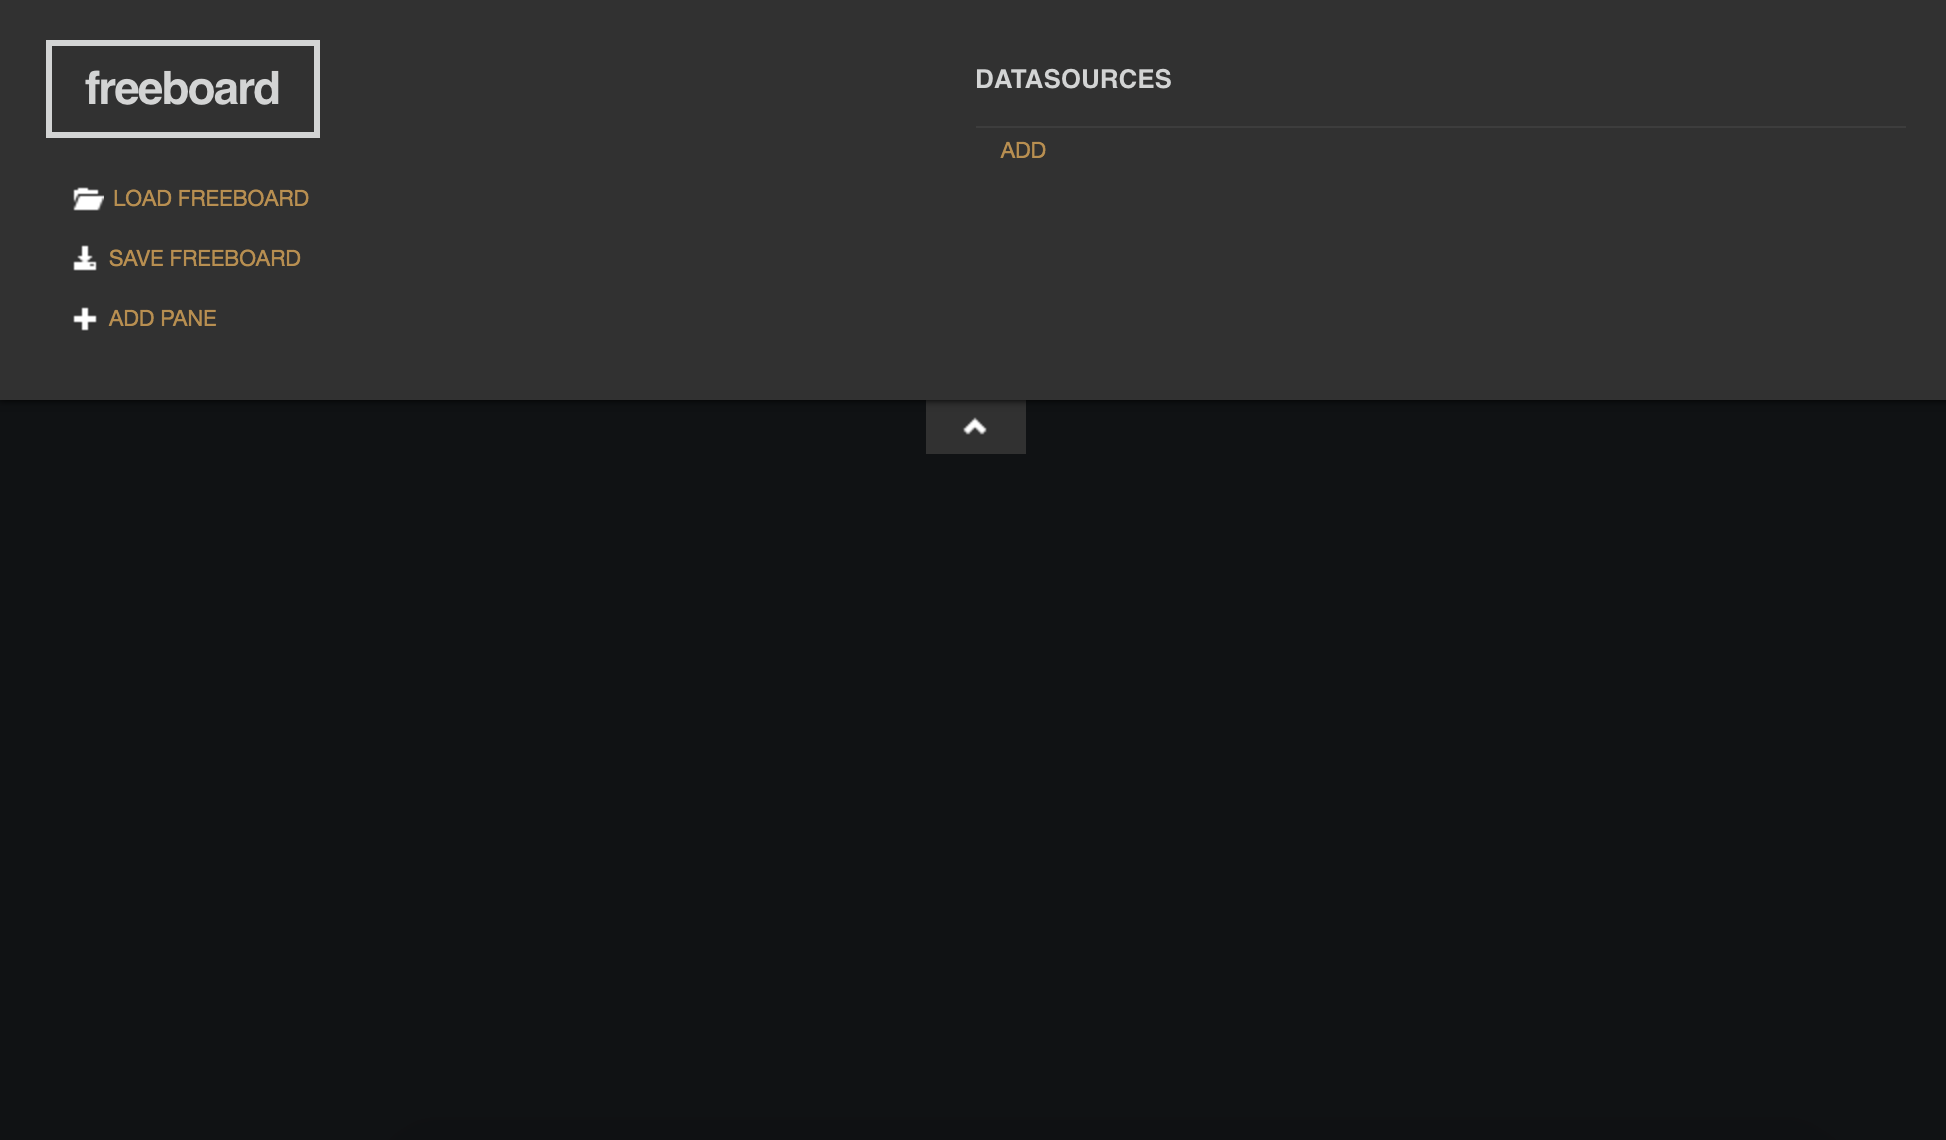
This tab will allow you to create visualization in FreeBoards, save them and load them. Let’s create a visualization of our weather data. We first need to add a datasource to our freeboard. Click on “Add” under “DATASOURCES”. Under “type” select the name of the “freeboard” node we configured above. In our case we named it “freeboard”. This will allow us to access ANY data we connect to the “freeboard” node in Node RED.

We will now add a Pane. Click on “ADD PANE”, this will add a new empty pane:

Now, we will add a “Widget”, click on the “+” (plus) sign in the new pane. Select “Gauge”. Under “DATASOURCE” select the “freeboard” node and select “tempc”. As you can see, all of the different data fields in the openweathermap JSON structure are available for you to visualize. FreeBoard essentially takes the JSON structure you pass it and breaks out any fields. If you can’t see this in the dropdown, go back to Node RED and click on “Deploy” again. So that the “freeboard” node can get some data and store the data it has received. Your configuration should look something like this:
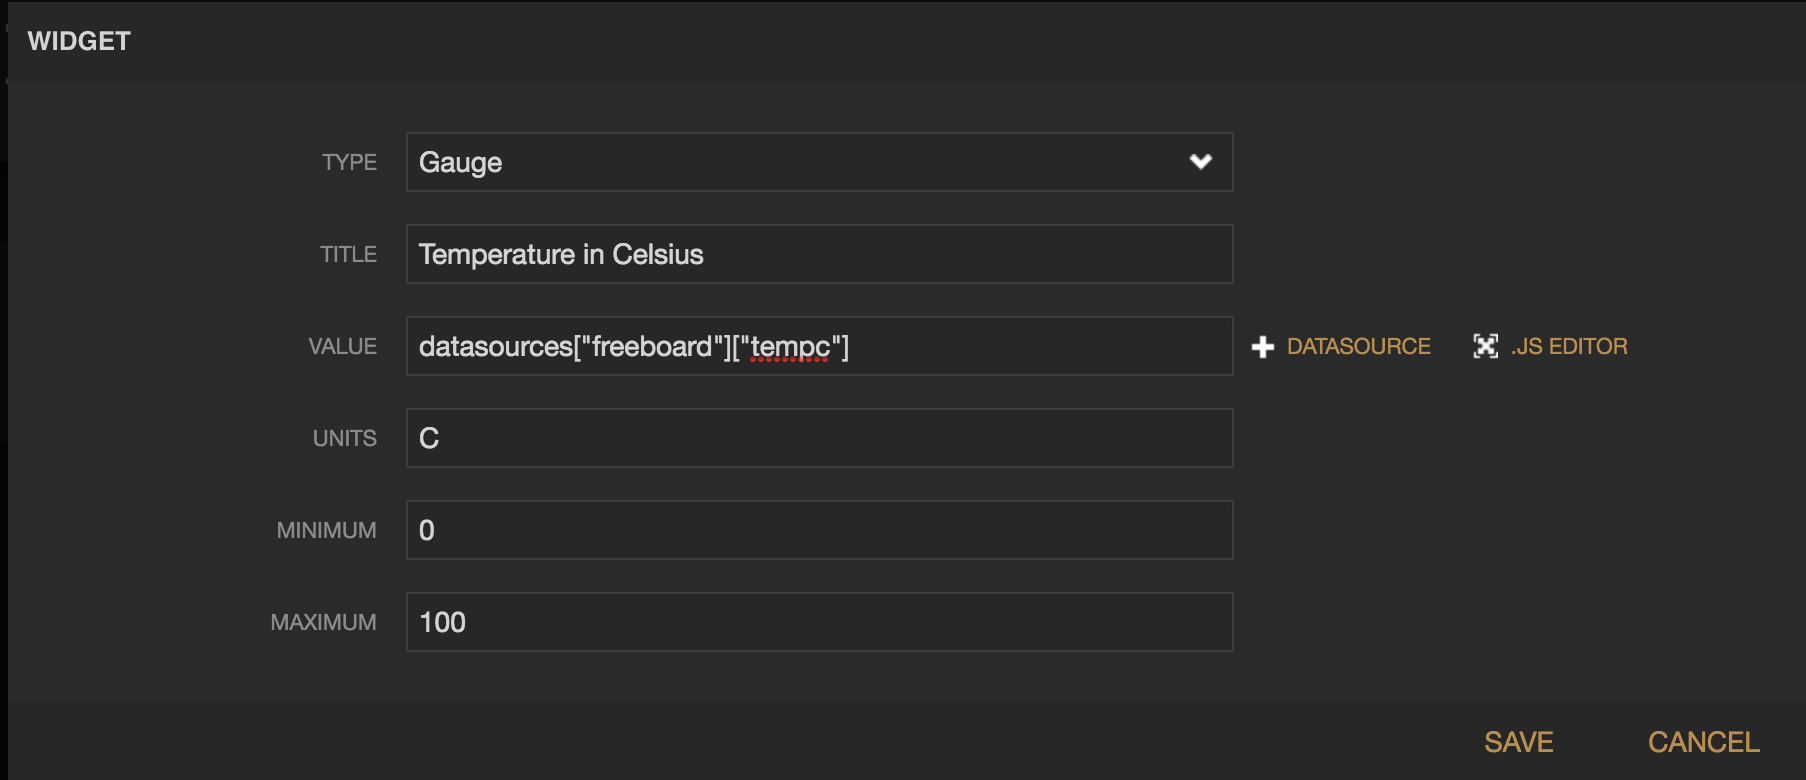
Click on OK. Which will build your widget and add it to the pane you created!
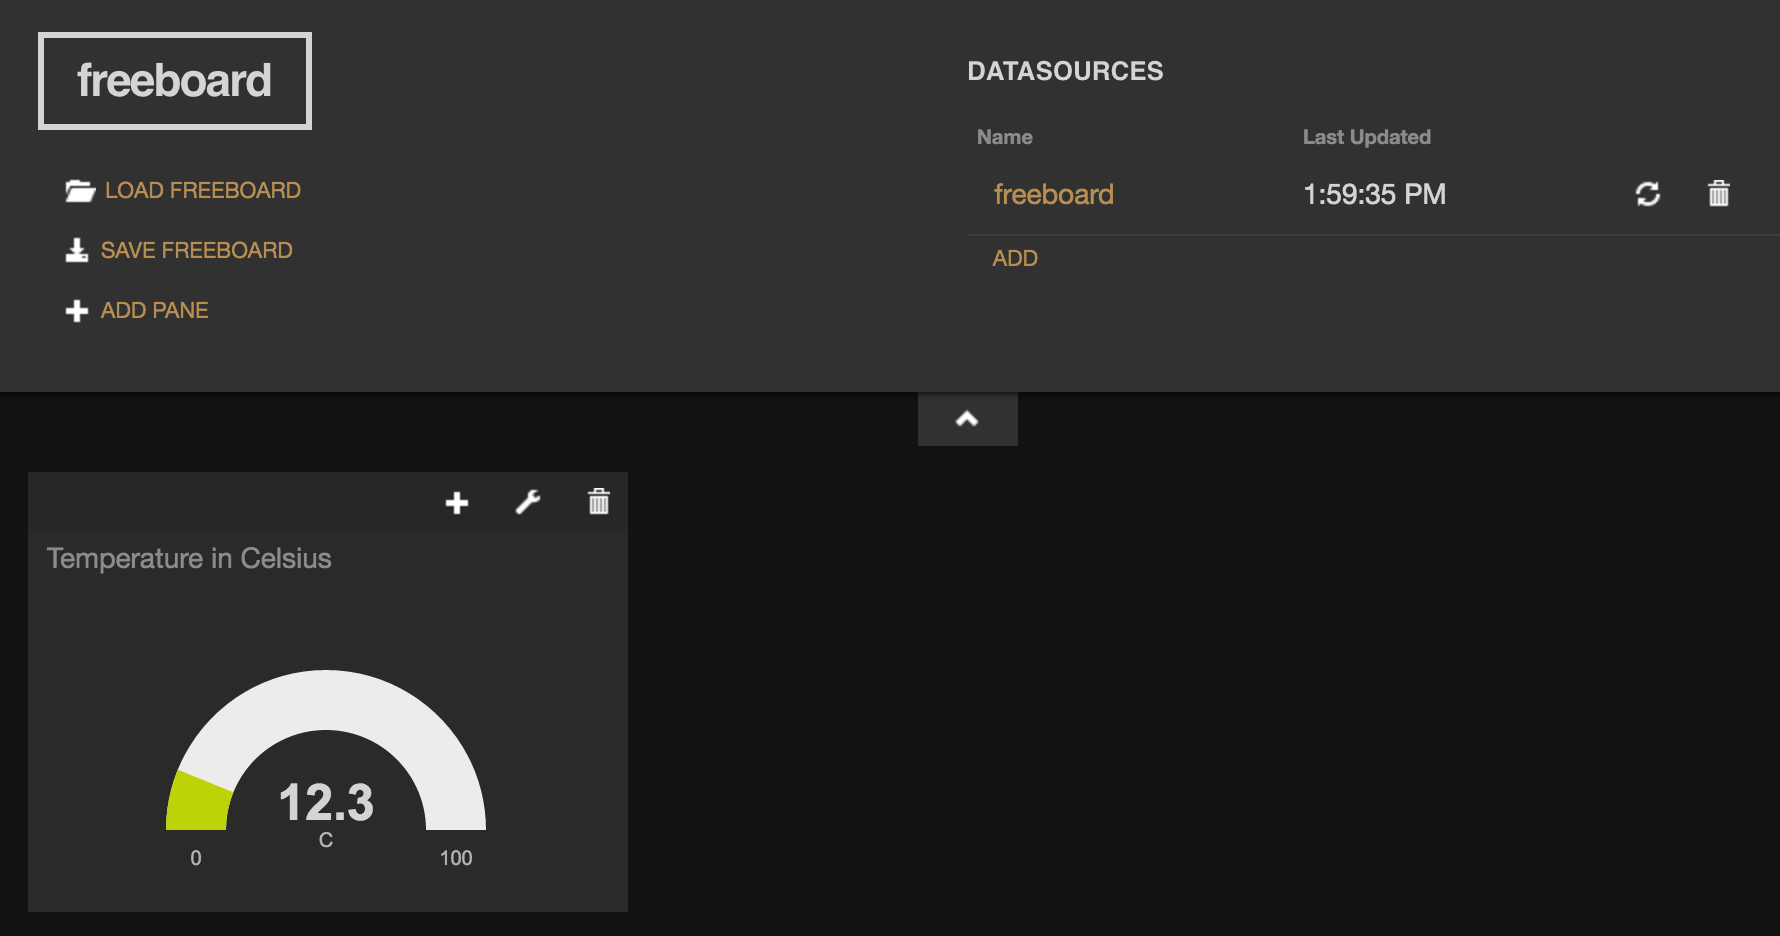
To save your dashboard click on “save”, and select [pretty] or [minify] which will save it in FRED and will show you the URL to access the Dashboard. You need to save the URL used to access the dashboard, e.g. as a dashboard. From now on you can access your saved dashboard by accessing the saved url, which will be similar to the one below.
https://{username}.fred.sensetecnic.com/api/freeboard/#start-16091
You can now go on to looking at two other UI techniques in Parts 2 and 3.
About Sense Tecnic: Sense Tecnic Systems Inc have been building IoT applications and services since 2010. We provide these lectures and FRED, cloud hosted Node-RED as a service to the community. We also offer a commercial version to our customers, as well as professional services. Learn more.
© Lea, Blackstock, Calderon

This work is licensed under a Creative Commons Attribution-NonCommercial 4.0 International License.