Node-RED’s dashboard nodes provide a comprehensive set of UI components for building basic dashboards suitable for the Internet of Things (IoT) – offering graphs, gauges, basic text as well as sliders and inputs. However, there will always be situations when you need something custom. The template node is the solution and in this tutorial we’ll show you a quick example of using it to create your own UI widget.
If you want a general introduction to the Node-RED dashboard or to UI techniques for Node-RED, then check out these resources which are part of our lecture series:
- Node-RED dashboard
- An alternative dashboard – FreeBoard
- Generic Node-RED UI using JavaScript charting
The template node
The ui template node is a generic node that takes valid html and Angular/Angular-Material directives and can be used to create a dynamic user interface element.
In this example, we’ll create a simple dashboard element that displays some fake random data mimicking data from the UK’s power generation network.
The dashboard widget using morris.js
We want our UI element to look as shown on the right of the screen shot below (you can read the tutorials on how to create the Table UI widget and the 2 line chart seperately)

To build this widget, we’re going to use a 3rd party JavaScript charting library morris.js – which is simple, quite powerful, but very easy to use. It has several charts including excellent line and area charts. For this example we’ll use a donut chart since it’s not available in the Node-RED dashboard widget set.
Apart from setting up the fake data, and drawing the donut chart, two key aspects of this tutorial which are generic issues and will be needed whatever external libraries you use are:
- loading the external libraries – and making sure they are loaded before we get started
- watching for new messages as they arrive at the template node and using the msg.payload to update the chart.
The Node-RED flow
We’ll create a very simple flow for this example consisting of a timer to trigger action every 10 seconds, a function node to generate the fake data and the template node to display the data.
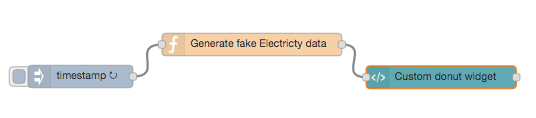
The timestamp node can be configured to fire every 10 seconds. The function node (Generate fake Electricity data) is a simple as possible. It generates a random number and then uses that as a seed to calculate fake values for the different generation types, ie Gas,Wind, Coal, Oil and Nuclear.
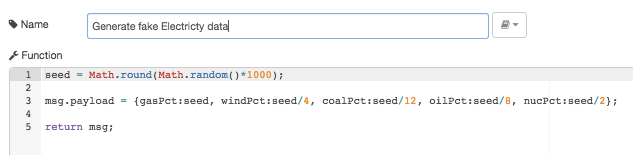
The fake data is dropped into the output msg.payload and sent on to the template node.
The template node is a little more complex than previous examples because we are pulling in an external charting library (morris.js) and it’s dependencies and we are writing some JavaScript code to use the incoming data (from the function node) to draw the donut chart.
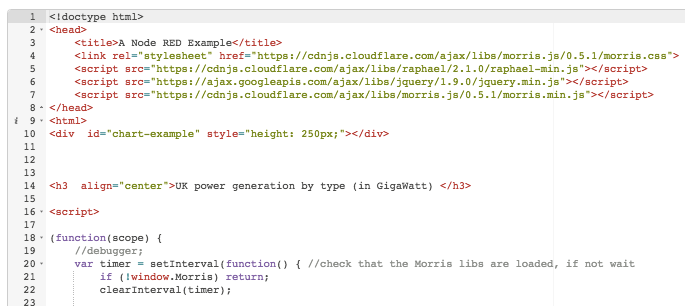
The first part of the template node is fairly standard and uses script tags to define the src for the JavaScript libraries that we will be using. These are hosted on cloudflare.com or googleapis.com (they can be hosted anywhere – although if you are using FRED, you can’t store them locally).
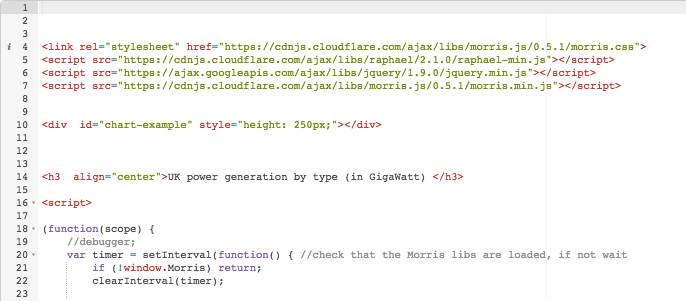
After the libraries are referenced, we define a <div> (line 10) that is the element that the chart library will use and a simple header for the chart (line 14).
The actual javscript starts at the <script> tag at line 18 and is shown below.
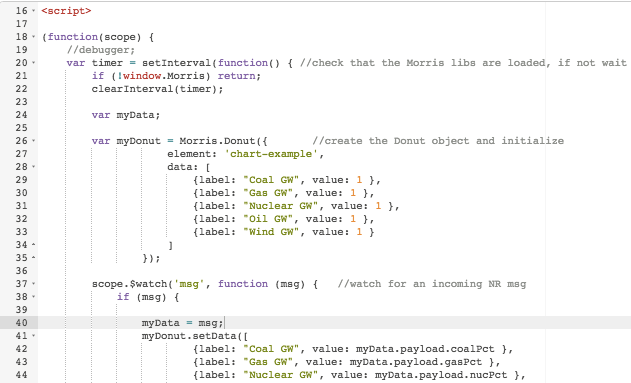
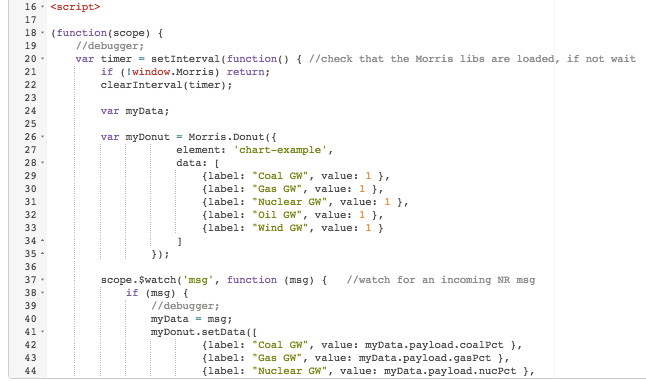
There are 3 main pieces of this code -checking that the external libraries are loaded (line 20-22), the creation of the Morris.Donut object and its initialization (lines 26-35), watching for new Node-RED messages and updating the chart (lines 37-49). All of this is wrapped in a function that accesses the Angular scope for this DOM object.
Check external libraries are loaded
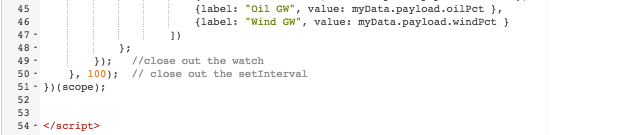
Lines 20-22 use a setInterval function to set up a simple repeating function that firstly checks that the external libraries are loaded. It does this by checking to see if the Morris object exists (line 21). If not the function returns and exits at line 50 where we wait (100 ms) before trying again. This simple code pattern is critical and is required whenever you use external libraries in the template node. This is because Angular is async and will happily tell the browser to start loading external libraries and then get on with running your code without waiting for them to finish loading. If the libraries aren’t loaded, the first time you try and use them you’ll get an undefined error.
Create the morris.js donut chart element and initialize it
It’s beyond the scope of this tutorial to explain the details of the morris.js library. You can check out an example we’ve written previously or the many examples available online, eg here or donut example
However, as can be seen, line 26 creates a new instance of the Morris.Donut object. Creation requires a minimum of an element (the HTML element that will be used for displaying the donut chart) and an array of data to display structured as <label:labelname><value:actualvalue>. We create a dummy array with all values set to 1.
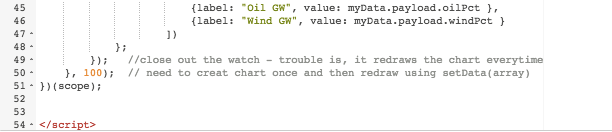
Watch for incoming msg.payload
To update the donut chart, we want to look at the incoming Node-RED message, and use its payload to update the donut chart. To do this, we use a watch function at line 37 to look for changes to the scope variable msg, which contains the incoming Node-RED message.
Again, the details of how Angular works is beyond this simple tutorial. A good overview is available on the Angular docs page. Briefly, Angular implements a Model-View-Controller (MVC) in which the model (the data) is separate from the view (the DOM). Controllers (code), Expressions and Directives manipulate the data which dynamically updates the view (the Dom) so you see the changes. The model is managed in a structure referred to as the scope.
So coming back to our example, the code at line 37 tells the template node to look at the scope (all our data) and watch for changes to the variable msg. When msg changes, in this case because a new Node-RED message has arrived, the function then executes (lines 38-48) and simply extracts the new data from the msg.payload and uses it to call the setData() function on the Morris.Donut object (myDonut) which dynamically updates the donut chart.
All of the above is wrapped in a function (lines 18-51) which passes the scope so that it can be accessed using the watch method.
Conclusion
Once you setup the flow, you’ll be able see the new UI element on your dashboard and as the flow triggers a new message the donut chart will update.
We’ve chosen to use a simple external charting library for this example, Morris.js – which is quite simple. However the techniques used here are the same for all external libraries so feel free to replace Morris.js with any of the many other charting libraries out there.
 <link rel="stylesheet" href="https://cdnjs.cloudflare.com/ajax/libs/morris.js/0.5.1/morris.css">
 <script src="https://cdnjs.cloudflare.com/ajax/libs/raphael/2.1.0/raphael-min.js"></script>
 <script src="https://ajax.googleapis.com/ajax/libs/jquery/1.9.0/jquery.min.js"></script>
 <script src="https://cdnjs.cloudflare.com/ajax/libs/morris.js/0.5.1/morris.min.js"></script>

<div id="chart-example" style="height: 250px;"></div>

<h3 align="center">UK power generation by type (in GigaWatt) </h3>

<script>

(function(scope) {
 var timer = setInterval(function() { //check that the Morris libs are loaded, if not wait
 if (!window.Morris) return;
 clearInterval(timer);

 var myData;

 var myDonut = Morris.Donut({
 element: 'chart-example',
 data: [
 {label: "Coal GW", value: 1 },
 {label: "Gas GW", value: 1 },
 {label: "Nuclear GW", value: 1 },
 {label: "Oil GW", value: 1 },
 {label: "Wind GW", value: 1 }
 ]
 });

 scope.$watch('msg', function (msg) { //watch for an incoming NR msg
 if (msg) {

 myData = msg;
 myDonut.setData([
 {label: "Coal GW", value: myData.payload.coalPct },
 {label: "Gas GW", value: myData.payload.gasPct },
 {label: "Nuclear GW", value: myData.payload.nucPct },
 {label: "Oil GW", value: myData.payload.oilPct },
 {label: "Wind GW", value: myData.payload.windPct }
 ])
 };
 }); //close out the watch
 }, 100); // close out the setInterval
})(scope);


</script>
About Sense Tecnic: Sense Tecnic Systems Inc have been building IoT applications and services since 2010. We provide these lectures and FRED, cloud hosted Node-RED as a service to the community. We also offer a commercial version to our customers, as well as professional services. Learn more.