Node-RED’s dashboard nodes provide a comprehensive set of UI components for building basic dashboards suitable for the Internet of Things (IoT) – offering graphs, gauges, basic text as well as sliders and inputs. However, there will always be situations when you need something custom. The template node is the solution and in this tutorial we’ll show you a quick example of using it to create your own UI widget. Continue reading “Tutorial: Node-RED dashboards – creating your own UI widget”
Tag: node-red ui
Lecture 7: Node-RED dashboard (Part2)
This second example uses the built in dashboard nodes that come with Node-RED. Before we start, make sure you have installed the dashboard nodes (node-red-dashboard) using the Menu - Manage palette option and search for node-red-dashboard, or run the following command in your Node-RED user directory – typically ~/.node-red
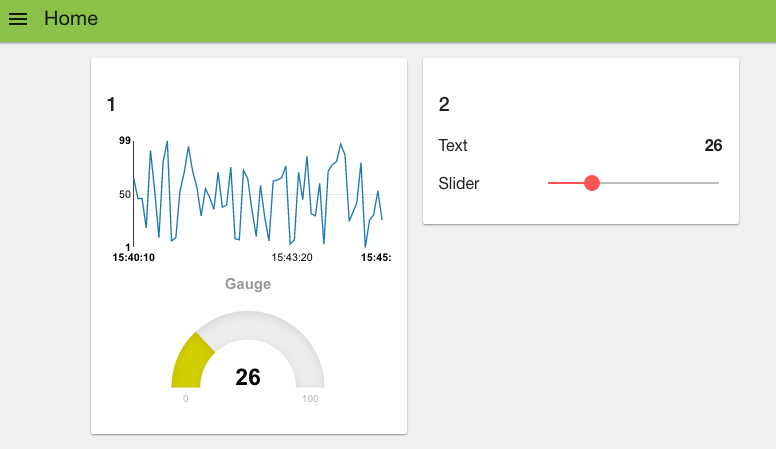
Our goal is to create a dashboard like the one shown below
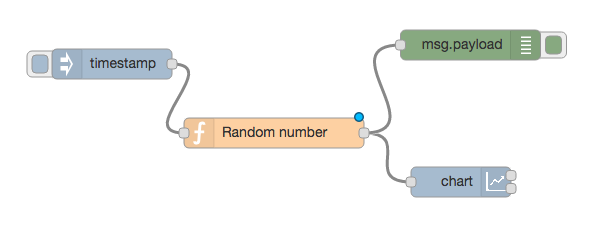
To start, let’s wire up a simple flow that sends a random number between 0 and 99 to a simple chart. For that you’ll need an inject node to repeatedly fire every few seconds, a function node to generate the random number and one of the node-red-dashboard nodes – in this case the chart node.
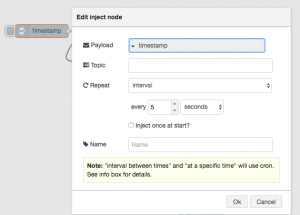
Before we look a how the chart node works, let’s configure the inject node to send a timestamp every 5 seconds by setting the payload to timestamp and the repeat field to an interval of 5 seconds.
This will act as our repeating trigger. Now we need to set up the function node to generate a random number – we’ll use a simple JS math function to do this:
msg.payload = Math.round(Math.random()*100);
return msg;
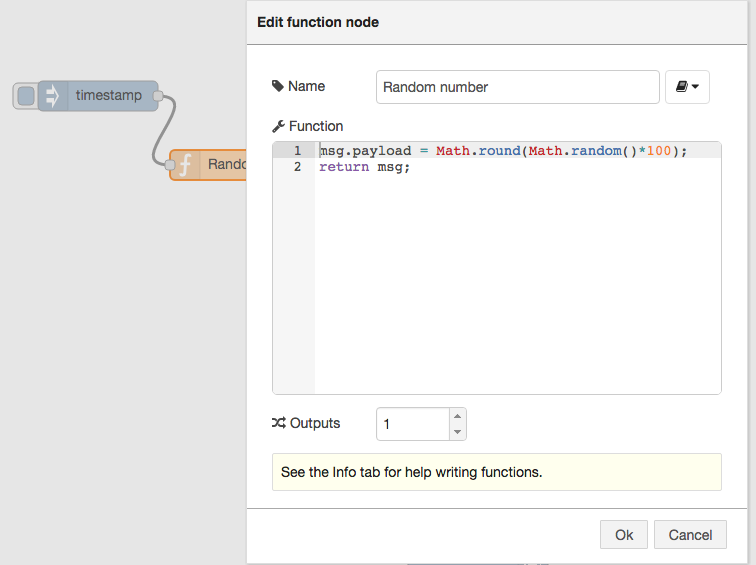
This will generate a random number between 0 ~ 99 which is passed to the chart node.
So now let’s take a look at the chart node. When you double click it, you’ll see it’s configuration options:
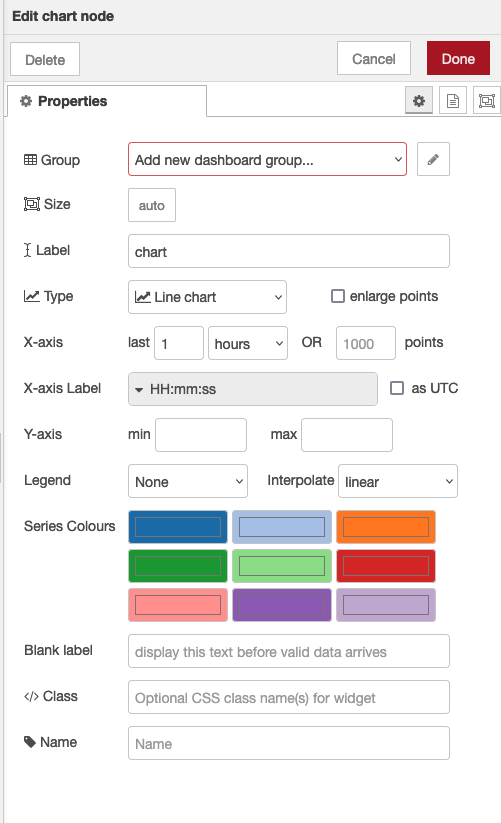
If you click on the button of the Group field, you will be prompted to configure the groups of the UI. If you select “add new dashboard group” you can define tabs for the dashboard and ui groups on those tabs.
- The Tab option allows you to specify which tab of the UI page you will see the UI element on – in this case our chart. The default tab is Home – which we are using here. If you select the edit button to the right of the Tab field you can create a new tab and then select that. However, we’ll use the default home for now.
The Label field is name shown when displaying the chart – by default this is chart but you can set it to anything you like.
The Group field also allows you to group UI elements – we’ll show you how that works when we add another UI element so let’s use group “Default[Home]” for now – of course, you can use any string you like.
The Type field allows you to select various types of chart, we’ll use the default line chart here.
The X-axis field allows you to tell the chart how much data it should store and display – the longer the ‘last‘ filed is set to, the more data is stored and displayed by the chart. Let’s use a short 5 mins which will start to throw away the data that is 5 minutes old.
Lastly the Interpolate field defines how the chart will interpolate values in between actual data values it receives, you can select between linear, step, b-spline and cardinal – which are standard interpolation algorithms. We’ll use the default linear.
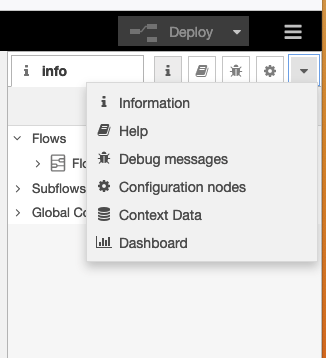
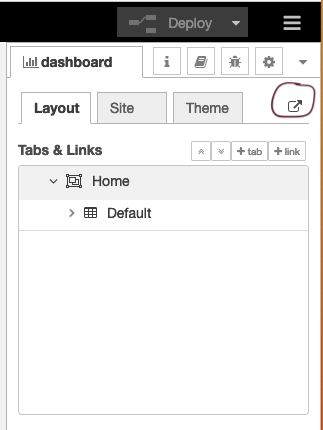
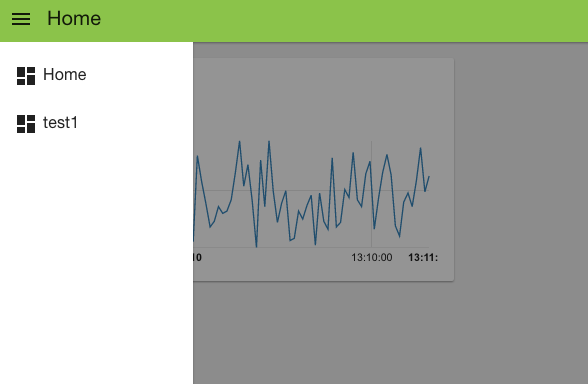
Wire these nodes up, hit the deploy button – check that your debug node is showing that random values are showing. Then head over to your default dashboard page to see the results. You can see your dashboard by selecting view->dashboard from the main menu and then clicking the ‘goto’ icon (circled below).
When you visit that page you’ll see your initial chart as shown below:
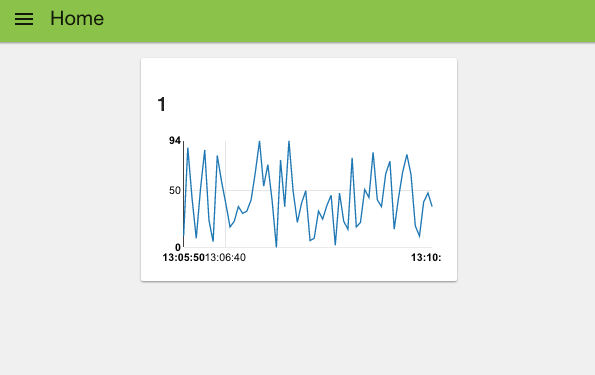
As you can see, you get a nice line chart, scaled for your data values (X axis) and the time they arrived (y axis). You can also see “Default” at the top left of the chart, indicating this is UI group “Default” – which is the group name we set in the configuration fields for the chart node.
If you look at the top left of the web page, you can see that we are, by default, on the home tab. If you had created your own tab then when you click the selector top left you’ll get a pull down menu of your tab options:
That was pretty simple, let’s add a few other UI elements to our dashboard. Firstly let’s create a gauge to show the last data value sent. Drag a Gauge node from the UI palette and wire it to the Random Number function node.
Then double click to open up and let’s configure it:
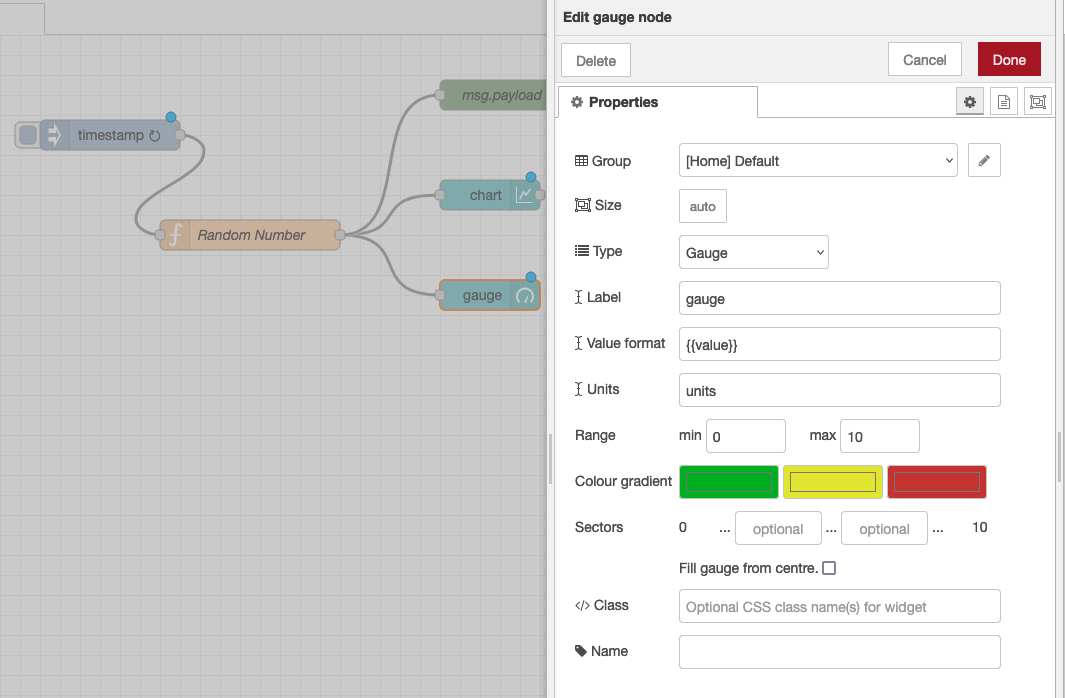
We’ll us the same Tab, home and we’ll also add it to the same group – “Default[Home]”. The Min and Max fields allow you to set the min and max values the gauge will shown. Make sure the max is set to 100 which is the most that the random number function node will generate. You can also change the Colour gradient to show different colours on the widget, but we will leave it as default for now.
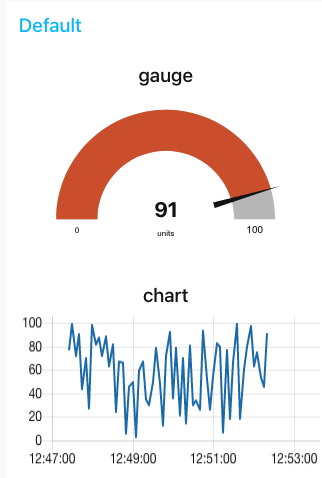
Hit deploy and then head over to your dashboard and you’ll see that the chart and gauge are displayed in a group with the chart now showing the last 5 minutes of data and the gauge the latest value.
As a last example, let’s use a couple of the other UI nodes, a slider node and a text node to show the same data on a slider and as a text string.
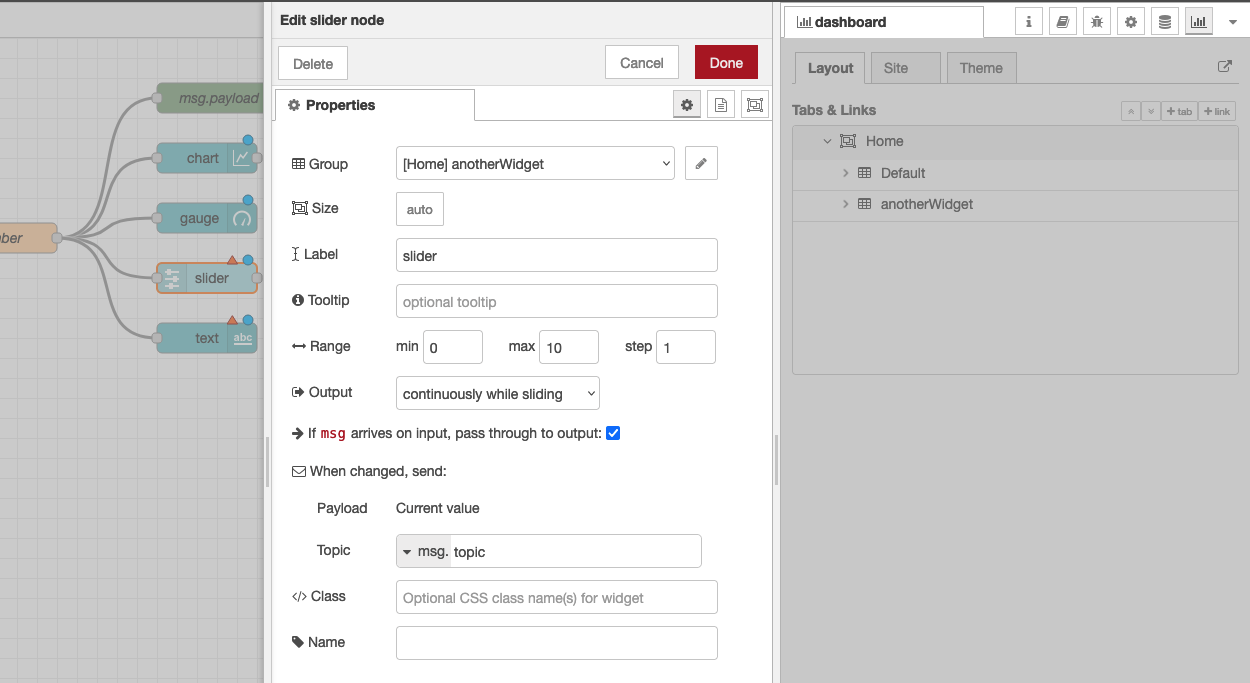
For these two nodes, configure them to use the same tab – “Home” but use group name “anotherWidget”(You will need to click “Add new UI_group” from the drop down menu of the Group field, and then click the edit button). You will also need to change the min and max value for the slider node to show the correct position of the slider. Deploy those and let’s take a look at your dashboard. As you can see, we now have two widget groups, group “Default” with a chart and a gauge, group “anotherWidget” with a text filed and a slider. Simple eh?

In the dashboard tab beside your debug tab, you can also set the theme and order of the elements. If you don’t see the dashboard tab, click the menu button at top right corner, then select “View” -> “Dashboard”. You can see all the widgets and tabs showing in a tree structure, and you can easily drag the elements to change the orders that they are presented in the dashboard.
Now you’ve got the basics sorted out, play around with the different dashboard elements to build your own dashboards using some real world data – have fun!
Part 1 Part 3
About Sense Tecnic: Sense Tecnic Systems Inc have been building IoT applications and services since 2010. We provide these lectures and other tutorials as a service to the community.
Tutorial: Advanced dashboards for Node-RED (and cryptocurrency)
In this tutorial we’ll combine two interesting areas, how to build interactive dashboards in Node-RED with use of the Binance cryptocurrency node created by the folks at Sense Tecnic Systems Inc.
The dashboard we are aiming for is shown below and the full flow can be copied and pasted into your own Node-RED canvas from the code block at the end of this tutorial.
Continue reading “Tutorial: Advanced dashboards for Node-RED (and cryptocurrency)”Dashboards and graphs for cryptocurrency data using Node-RED: tutorial
Graphing cryptocurrency data using Node-RED
This is the second tutorial in a series on using the Binance cryptocurrency node we have developed. Take a look at the first tutorial if you haven’t already done so as it introduces you to the basics of the Binance node. This tutorial develops a simple dashboard showing bid and ask prices for symbol BTCUSDT and will look a little like this: Continue reading “Dashboards and graphs for cryptocurrency data using Node-RED: tutorial”