Graphing cryptocurrency data using Node-RED
This is the second tutorial in a series on using the Binance cryptocurrency node we have developed. Take a look at the first tutorial if you haven’t already done so as it introduces you to the basics of the Binance node. This tutorial develops a simple dashboard showing bid and ask prices for symbol BTCUSDT and will look a little like this:
The Binance node
For those of you who aren’t familiar, Binance is one of the largest crypto trading platform (perhaps largest by volume), and importantly has a comprehensive and sophisticated API. The resident cryptocurrency expert, Ted, over at Sense Tecnic Systems (STS) recently decided to jump in and develop a new Node for accessing and using the Binance cryptocurrency platform.
Like all these tutorials and lectures, we use the FRED cloud Node-RED service to develop our flows as Of course you can run Node-RED on your own machine. If you plan to use your own Node-RED installation, then you can download the Binance node from NPM download . If you are using FRED it’s already pre-loaded and can be activated by using the add/remove nodes button under tools on the management panel.
Basic dashboard example
In this tutorial we are going to show you how to use the Node-RED ui nodes with the Binance nodes to get basic exchange data and show it on a dashboard.
We’ll assume you have some knowledge of using the Node-RED ui nodes, if not, you may want to take a look at part 2 of the dashboard and UI techniques lecture.
Displaying bid/ask data
To get started, let’s set up a simple flow that shows the bid/ask price for BTCUSDT ticker pair that we used in the previous tutorial. We’ll use the getBookTicker node which returns bid and ask price, and we’ll place that info on a dashboard using the simple text widget ui nodes. The flow is shown below.
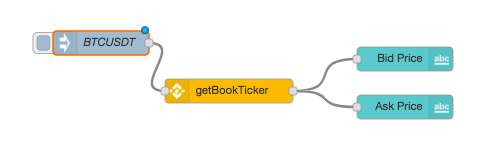
The first two nodes should be familiar from the previous tutorial. The text widget nodes require a little explanation.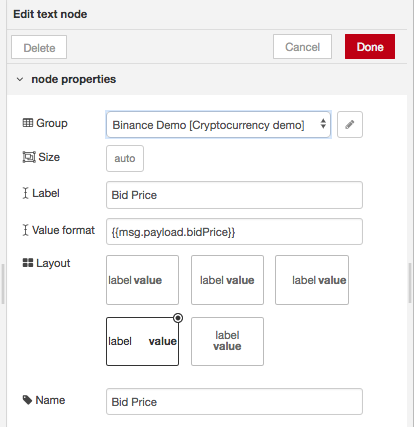
Two things to note here are:
- We’ve created a new UI group Binance Demo which is displayed on the newly created Cryptocurrency demo tab – again checkout lecture 7 part 2 if this is new to you. If you use the default home that’s ok and it will appear, with any other dashboard elements on your default home dashboard.
- Secondly, we use the moustache formatted string {{msg.payload.bidPrice}} in the Value format field to tell the text UI node that we want it to display the bidPrice element of the message payload.
The askPrice UI node is set up in a similar manner, but obviously specifies the askPrice element of the msg.payload field.
Once deployed, you can access your dashboard using the dashboard tab on the Node-RED info pane (next to debug) or if you are using FRED, go directly to your own UI using the generic: URL https://[USERNAME].fred.sensetecnic.com/api/ui/#/0
Don’t forget to change USERNAME to your FRED user name – and you will need to select the correct tab if you have more than one dashboard.
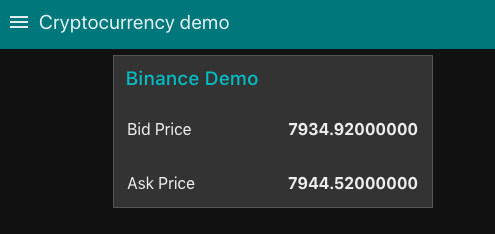
When you click on the inject node in your flow, and then take a look at your dashboard, you should see a simple UI like the one shown below with the bid and ask price for BTCUSDT.
Adding a chart
Let’s spice up our dashboard a little by adding a chart. For this, we keep the same basic flow, but add a graph UI node. We’ll also need to take the output from the getBookTicker node and ‘massage’ it a little so the graph node can display both the ask price and the bid price on the same graph. Here’s the updated flow:
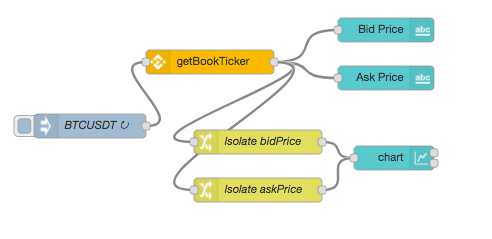
As you can see we’ve added two change nodes and named them isolate bidPrice and isolate askPrice. Change nodes allow you to take input messages and change the output based on a set of rules. To be able to use the chart properly, we need to deliver a msg.payload with a chartable value, and a msg.topic set to the name of the chartable value. If you take a look at the screenshot below, you can see how we set up a change node to do that.

Our first rule sets the output msg.payload, to the value received in the msg.payload.bidPrice element. Our second rule sets the msg.topic to the text field “bidPrice”. We do the same for the isolate askPrice change node and wire both up to the chart node.
Lastly, for the chart node, we leave it setup to default, except we change the group to place it into the same UI group as our text ui nodes, in our case Binance Demo [Cryptocurrency demo]
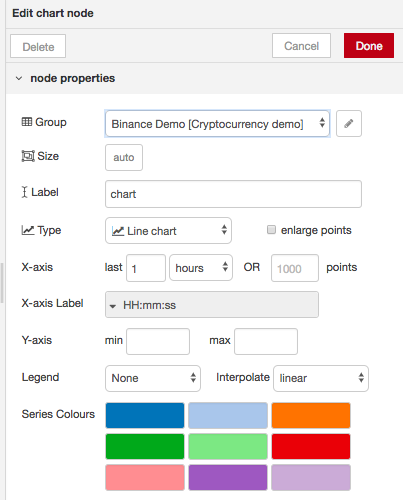
Now that we have two messages arriving at the chart node, it will use the msg.topic field to distinguish between the two and will apply a series colour to the data series that arrive, in our case dark blue to series 1 (bidPrice)and light blue to series 2 (askPrice).
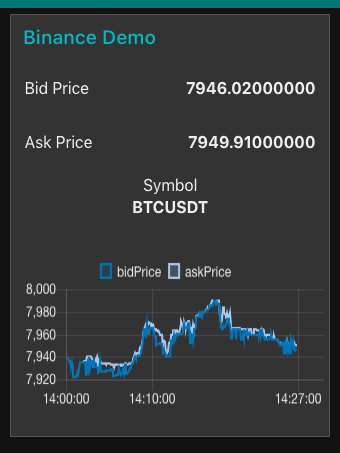
The last thing we do is change the inject node to repeat every 10 seconds so we don’t have to keep clicking on it. Deploy and take a look at the dashboard which should look like the screenshot below.
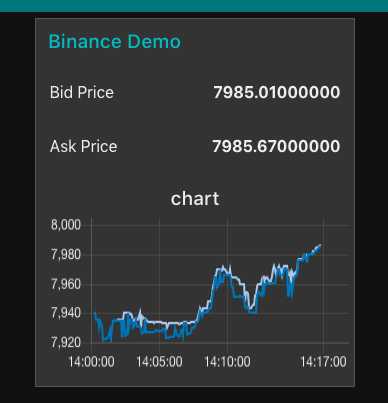
The dashboard will update automatically every 10 seconds. Moving the mouse over the chart lines will show you data for the ask and bid prices at that point in time.
Lastly, you should clean up the UI by adding labels etc.
Have fun!
About Sense Tecnic: Sense Tecnic Systems Inc have been building IoT applications and services since 2010. We provide these lectures and FRED, cloud hosted Node-RED as a service to the community. We also offer a commercial version to our customers, as well as professional services. Learn more.