This lecture will introduce you to the Node-RED visual tool and get you started building your first flow. You’ll learn how to create simple flows, use debug nodes to track messages through the flows and how to use the function node to write simple JavaScript code that tailors the node to your specific needs.
For all these lectures, we assume you have access to a Node-RED installation, either on your local PC/Mac, or a local device such as a Raspberry Pi. Alternatively, you can use a cloud service such as Azure and install Node-RED there. The community Node-RED site has instructions to get you started.
The Node-RED UI
Once you have started up your Node-RED editor, you’ll see the standard Node-RED UI which consists of three main panes, as shown in Fig 2.1
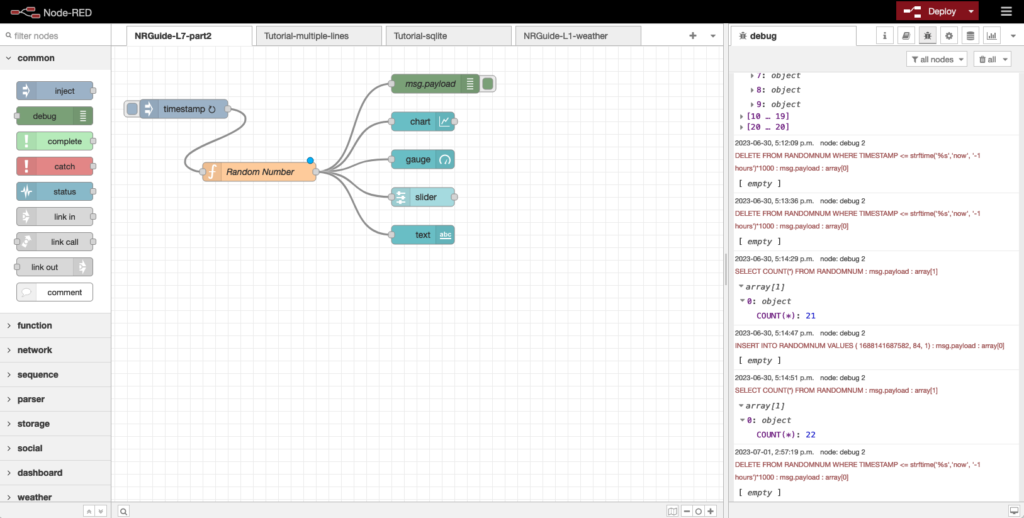
Figure 2.1 The Node-RED UI – showing the node palette (left), flow canvas (centre) and output pane (right)
The main pane is the flow creation workspace or canvas in the middle. This is where you drag and drop nodes and connect them with wires. Along the top of the workspace pane is a set of tabs. Each tab opens a previously created workspace and shows any flows created using that workspace.
On the left is the node pane that contains all the pre-built nodes that your instance of Node-RED has installed. In the example above, these are grouped into categories such as common, function, network etc – and we have opened up the common category to show the nodes installed.
In later lectures you will learn about these nodes and use them to develop new flows.
On the right-hand side is the output pane that can be toggled between several tabs including the info, help and debug tabs. When info is selected, info on the selected node is shown there. When help is selected, documentation for the node is shown and when debug is selected, it will display the output of debug nodes, errors and warnings.
Above these three main panes is the usual toolbar, and on the right-hand side are two widgets, a deploy button and a pulldown menu for admin and control. You’ll look in more detail at the pulldown later in these lectures.
The Deploy button is used when a flow has been constructed and causes the flow to be deployed onto the Node-RED system and executed. You’ll be introduced to the details of what’s actually happening under the covers in lecture 5 and beyond. For now just treat the Deploy button as the way to get your flow running.
A quick tour of Node-RED nodes and messages
As you saw in lecture 1, Node-RED allows you to wire together nodes to create flows which carry out your programming task. Messages pass between nodes, moving from input nodes through processing nodes to output nodes. Let’s take a brief look at nodes, flows and messages.
There are three main types of nodes:
- Input Nodes (e.g. inject)
- Output Nodes (e.g. debug)
- Processing Nodes (e.g. function)
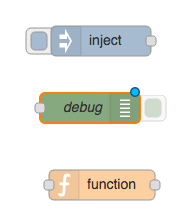
Figure 2.2 The main types of nodes: input, output and processing
Input nodes allow you to input data into a Node-RED application or “flow”. They have at least one output endpoint represented by the small grey square only on their right side. You use input nodes to connect data from other services, for example the Twitter, Google, serial, websockets or tcp nodes, or to manually input data into a flow using the inject node.
Output nodes allow you to send data outside of a Node-RED flow. They have a single input endpoint on their left side. You use output nodes to send data to other services, for example via Twitter, tcp, serial or email nodes, or to use the debug node to output to the debug pane.
Processing nodes allow you to process data. They have an input endpoint and one or more output endpoints. They allow you to transform the data type (e.g. json, csv, xml) nodes, use the data to trigger a message (e.g. trigger, delay) nodes and to write custom code that uses the data received (e.g. function node).
Note that some nodes, like the inject and debug messages, have a button that allows you to actuate a node (in the case of the inject node) or to enable and disable a node (in the case of the debug node).
Flows consist of multiple nodes wired together, with output tabs linked to input tabs of the next node in the flow. Messages flow along the nodes carrying data from node to node.
Node-RED nodes consume input messages and produce output messages. Messages are JavaScript objects that contain at least a “payload” parameter, like this:
Listing 2.1 A basic Node-RED message structure
- msg = {
- payload:”message payload”
- };
Nodes consume and produce messages, usually using msg.payload as the main placeholder for the data they consume and produce. However, messages can be extended to contain other parameters. For example, to set the topic of a message and add a new parameter, location, you could create a new msg object as shown in listing 2.2.
Listing 2.2 A more complex Node-RED message structure
- msg = {
- payload:”message payload”,
- topic:”error”,
- location:”somewhere in space and time”
- };
Let’s use this knowledge to create your first flow.
Example 2.1 Building your first flow: Hello World
Let’s go ahead and start building your first flow so that you can see how simple it is to use the Node-RED UI to build and deploy a flow.
Let’s start with the easiest flow possible, a node to inject some information into the flow, wired to a debug node to see the output from the flow as a debug message. Once you have that running, you’ll build it up to the full Hello World flow.
Since this is the first time you’ll be shown how to actually build a flow, let’s start slowly and explain each step with a screen-shot. Once you’ve created your first flow and seen how easy it is, you’ll mostly be shown a single picture of the final flow rather than all the screenshots.
Let’s start with the simplest Node, the comment Node. You’ll find this in the common section of the node palette. Drag and drop a comment node onto the flow workspace as shown in Fig 2.3.
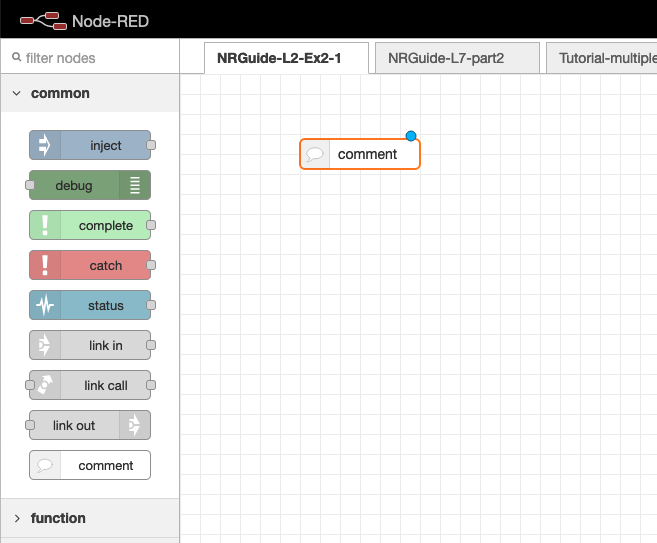
Figure 2.3: Using a comment node is a great way to add visible comments into flows
Once you’ve done that, double click on the comment node to edit its properties and to show the associated info pane on the right (remember to switch to info if the debug tab is selected). As you can see in Fig 2.4, you’ll see a little info on the node, including the node name, a unique ID. In the properties pane, you can rename the node – in our case to “My first NR flow” and you can ass your own description which will be shown in the info pane on the right.
For the comment node there’s not much to say; however, more sophisticated nodes have a lot more info.
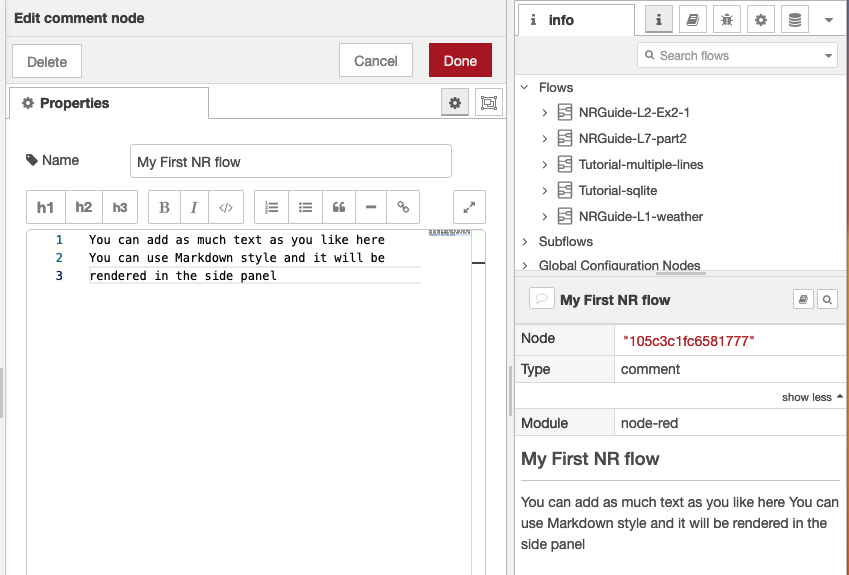
Figure 2.4 Give the comment a name and add any info you want in the text box
Ok, now let’s add the first node that actually does something, an inject node. The inject node is used to generate input into a flow and is one of the first nodes in the node palette under input. If you drag and drop an inject node onto the flow workspace, and then look at the help tab, you’ll see the documentation for the inject node. Note that the name of the node on the workspace changes from inject to timestamp, because the default behaviour for the node is to inject a timestamp – the current time in milliseconds since January 1, 1970.
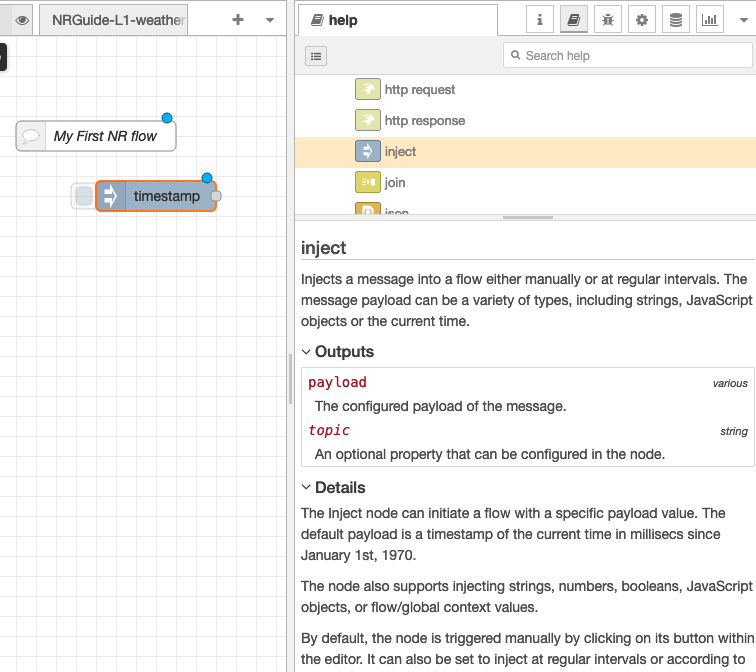
Fig 2.5 The inject node allows you to insert events as messages, defaulting to a timestamp
You’ll also notice that the inject node (now named timestamp) has a blue dot top right and a grey square centre right. The blue dot indicates that the node hasn’t been deployed since it was last changed; the grey square is the output point for the node. This is where you attach ‘wires’ that route output message from the inject node to the next node in the flow.
To get a sense for the inject node and the whole flow deployment process, let’s add a debug node to see what happens, wire them together and then deploy the flow and test it.
Start by dragging a debug node from the node palette to the workspace. Again you can look at the info for the node.
Then you’ll wire the two nodes together. To do that, click on the grey output point for the inject node and, holding the mouse button down, drag towards the debug node. An orange wire appears, which you can then attach to the grey input point on the debug node.
Figure 2.6 Wiring an inject node to a debug node

This is the simplest flow possible and will send the current timestamp to the debug node for display in the debug pane. Let’s try it!
Click the deploy button in the Node-RED window (top right). You’ll see a pop-up saying the flow has been successfully deployed. You will also notice that the blue dots on the nodes disappear, indicating there are no un-deployed changes.
Now, before you try the flow, make sure the the debug tab is selected on the right pane. Then click on the left tab on the inject node and look at what appears in the debug pane.
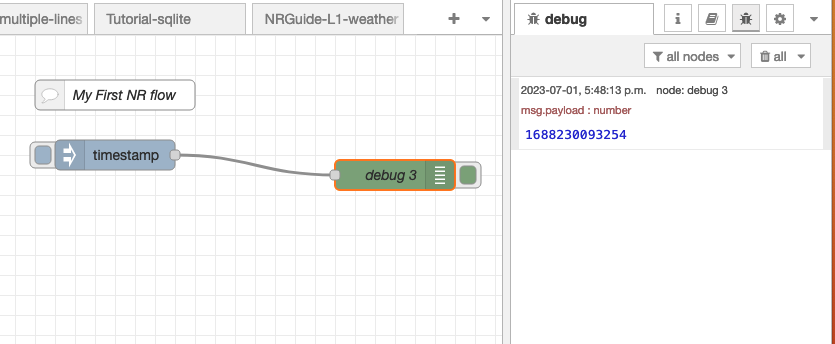
Figure 2.7 Debug output from your first flow – the time when you clicked the inject node.
As you can see, the inject node, when clicked, generates a timestamp – the number of milliseconds since January 1, 1970. This is then converted to a message and sent along the output wire, which is delivered to the debug node as an input message. The debug node’s default behaviour is to show any message it receives in the debug pane on the right.
Congratulations, you created and deployed your first flow!
If you find these lectures and tutorials helpful, why not buy us a coffee?
Let’s now augment it a little to see what else we can do with this simple flow. Firstly, we’ll edit the inject node to deliver a text message rather than a timestamp. To do that, select the inject node in the flow and double-click it. You’ll see a configuration window like the one in Fig 2.8.
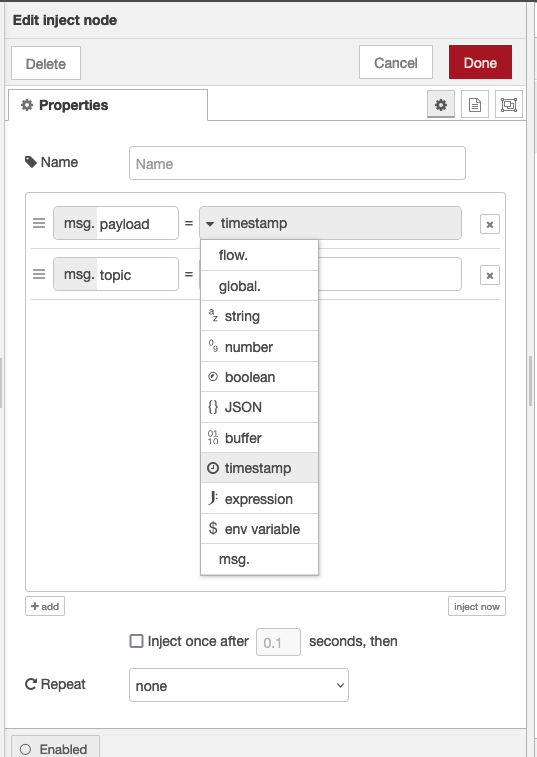
Figure 2.8 Editing an inject node to send text instead of a timestamp
In the payload field, select string instead of timestamp and then type any string you like into the blank field below the payload field. As is traditional, let’s start with “Hello World – from my first NR flow!”
Once you’ve made the change, click ok to save the changes and take a look at the flow. You’ll see the blue dot has appeared on the inject node (which has also returned to being called inject rather than timestamp) to indicate that you have un-deployed changes. Click the deploy button again to resolve that and then go ahead and click the tab on the inject node. If you look at the debug output you’ll see that instead of a timestamp, your text has been delivered as a message to the debug node, which displays it as usual.
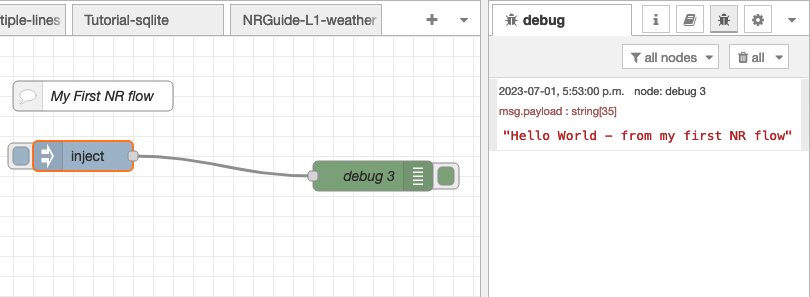
Figure 2.9 Sending a text message rather than a timestamp
Congratulations, you’ve written the Node-RED “Hello World” program! As you can see, it’s very easy to wire up some simple nodes and get data to pass through your flow as messages.
Messages and what they contain
At this stage, you’ll probably be wondering a little about the messages that are flowing between nodes. The debug node can be used to examine them in more detail.
All messages in Node-RED have three default properties: the payload, which we are seeing above, a message topic, which is a user-defined string describing what the message is about (its topic, if you will) and an internal identifier. You can actually see this information if you edit the debug node configuration. Let’s do that and look at the output (Fig 2.10)
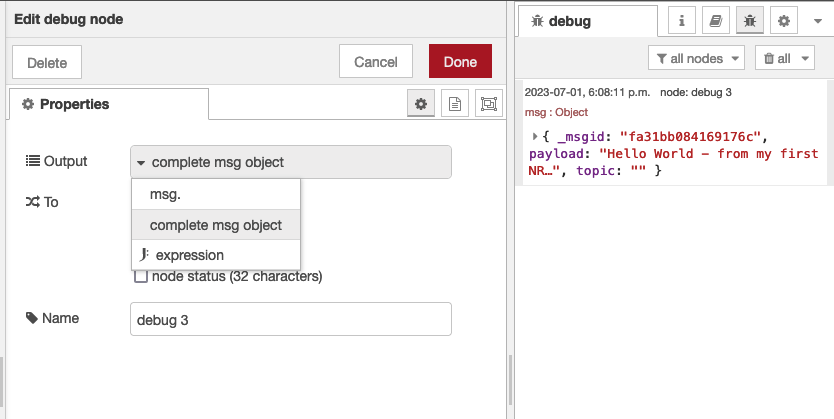
Figure 2.10: setting the debug node to show the internals of a message
Select the debug node, double click and change the node output field to “Complete msg object”. If you then save this, deploy again and click the inject node, you will see in the debug pane a JSON structure that contains 3 fields: an internal ID field “_msgid”, a “payload” which contains the string you set in the inject node and a “topic” which is currently blank. Generally the internal message ID field isn’t used. However, both the topic and payload are used extensively when developing flows. You’ll see more of that later in the lecture series.
These fields are extensible, so you can define new message properties, for example, msg.location, which could be used to add the latitude and longitude values for the source of the message. Let’s take a look at that in the next example flow.
You can find the node-red code of this flow, copy it and import it into your Node-RED editor here
© Lea, Blackstock, Calderon

This work is licensed under a Creative Commons Attribution-NonCommercial 4.0 International License.