This tutorial will show you how to make use of an SQLite database using the sqlite node to create database tables and store data. Under the hood, the sqlite node uses SQLite. As a very lightweight relational database, SQLite does not need complex setup procedures. This makes it an ideal database management system to use for embedded systems and rapid prototyping of IoT services.
Continue reading “Tutorial: SQLite and Node-RED”Author: Michael Blackstock
Node-RED: Lecture 5 – The Node-RED programming model
As you’ve seen in previous lectures, Node-RED uses a visual flow-based programming paradigm[1]. This is not unique to Node-RED. Similar approaches have been used in many other domains such as music and multimedia (Max MSP), toys (Lego Mindstorms), enterprise application integration and industrial automation (LabVIEW). Continue reading “Node-RED: Lecture 5 – The Node-RED programming model”
Extending the Arduino IoT Cloud with a cloud hosted Node-RED
Augment an Arduino-based weather station with external service notifications using a Cloud-hosted Node-RED service.
Published Dec 2021 – updated Aug 2023
Introduction
In this tutorial we’ll show you how to augment the Arduino Cloud service using a cloud-hosted Node-RED service for some simple data processing and notifications. This is a common use-case for Hosted Node-RED and Arduino Cloud. Arduino cloud offers a basic data gathering and dashboard facility, and the hosted Node-RED is used as a general purpose programming system to add value to the Arduino cloud.

Once you master this basic pattern – of offloading processing from Arduino to a cloud hosted Node-RED, you can use it for a variety of use cases, such as:
- Adding sophisticated cloud processing such as complex event management or cloud based machine learning to analyse your sensor data
- Leveraging third party service via FREDs easy nodes – eg IBM Watson, GE’s Predix or external DB services such as InfluxDB
- Gathering and combining data from multiple locations and sensors, combining with public data like traffic or weather and building complex, interactive dashboards.
For this tutorial, we’ll create a connected temperature and humidity sensor using an Arduino MKR WiFi 1010 connected to a DHT11 sensor. We’ll also add an external LED to indicate when the temperature is too high or low.
We’ll show you how to connect this device to the Arduino cloud service, create a ‘Thing’ in the service that exposes several properties corresponding to the sensors and LED. We can then use the arduino-cloud dashboard to interact with the device.
Finally, we show how we can develop a simple processing flow in Node-RED, that uses the arduino-cloud nodes available on the cloud Node-RED service to connect to the “Thing” on the arduino cloud and do some simple data processing as well as send data to an external notification service. For this tutorial we’ll use the PushBullet service.
Note – when we wrote this tutorial in 2021, we used the FRED cloud hosted Node-RED service. As of August 2023 that service is no longer available. An alternative is the FlowForge cloud hosted Node-RED which has taken over some of the FRED customers. This tutorial has not (yet) been tested with FlowForge, however the approach and flow is the same – although some details of UI etc differs between FRED and FlowForge.
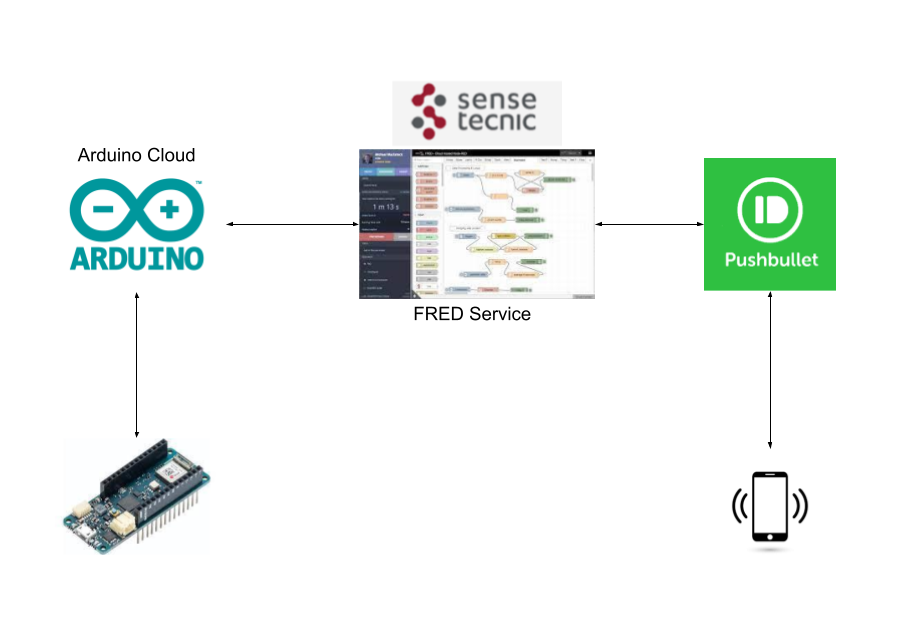
An overview of the set up is shown below.
This tutorial will talk you through the 4 main steps:
- Setting up the Arduino Weather Station Prototype board
- Connecting to the Arduino IoT Cloud
- Developing the Node-RED flow on FRED
- Connecting to the Pushbullet external notification service
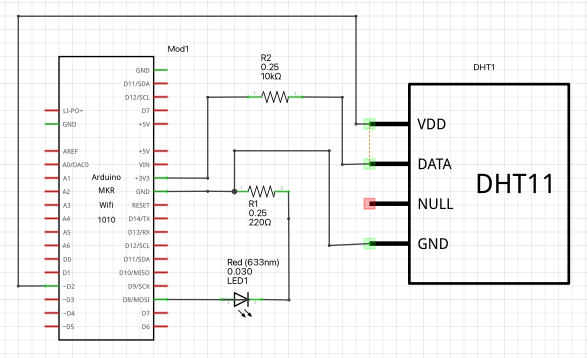
The Weather Station Prototype
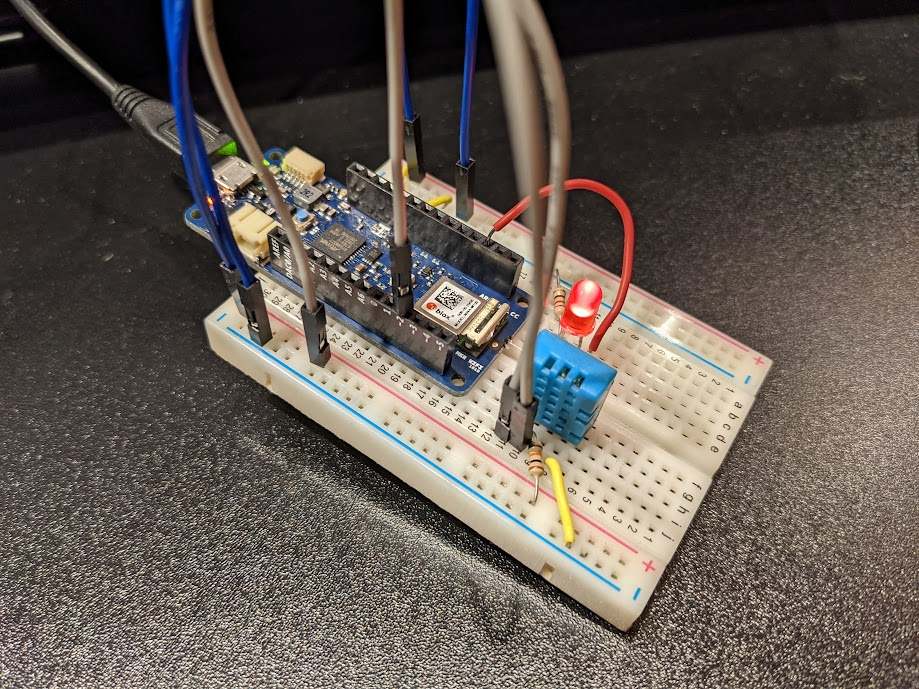
The prototype weather station device we’ll use is shown in Figure 2.
For this prototype you’ll need the following:
- Arduino MKR Wifi 1010 with USB cable to connect to your PC
- breadboard and jumper cables
- An LED
- 220 ohm and 10K ohm resistors
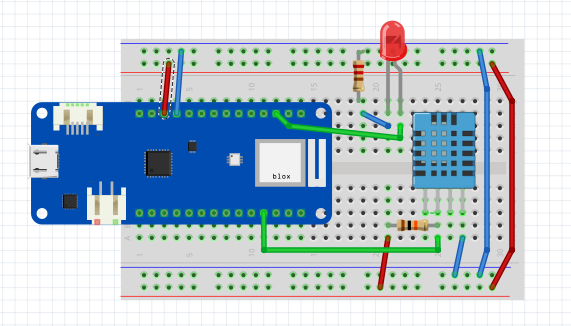
You can wire up the device as shown in Figure 3.
Testing the Device Using a Local Sketch
To ensure the device works, we’ll upload a test program into the device that reads from the sensors and blinks the LED every two seconds. The test program in the Appendix Listing 1 blinks the LED, reads the DHT11 sensor and sends the current readings to the serial monitor output.
To upload this sketch, you’ll need to install and run the arduino editor and connect the device to your Mac or PC using a USB cable. While you can download and run the arduino IDE locally, for this tutorial, we’ll use the arduino web-editor. To get started see the Getting Started with Web Editor tutorial.
To use the web editor, you need to create an Arduino account. (You’ll need to do this to use the arduino cloud service later anyway so now is a good time to get that done.) Once you have an account, you need to install a browser plugin. Finally ensure your Arduino board plugged into the USB port is recognized by the computer.
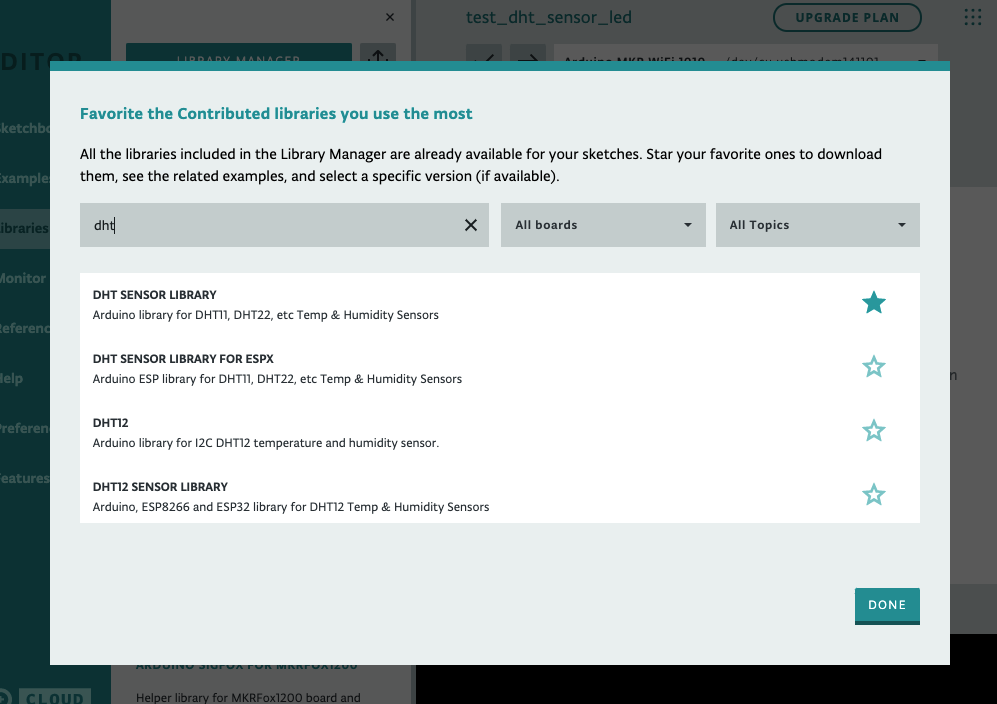
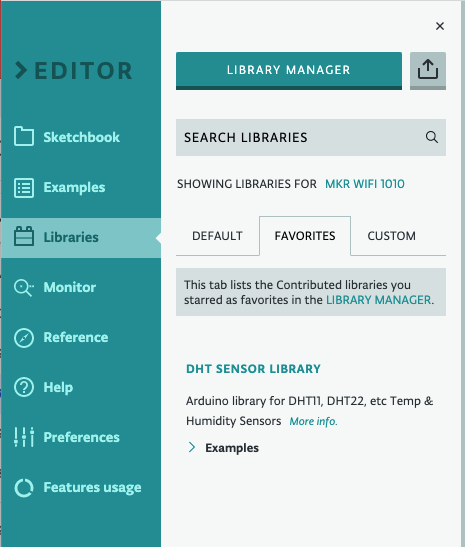
Before you can upload the test sketch, you’ll need to include the DHT Sensor Library. To find it, click on the Library Manager button on the web editor, and then search for DHT as shown in Figure 5. It will likely be near the top as shown. Click on the star to make it available in your favourites so you can use it in your sketches.
You can then copy it to your editor and upload it to your board to ensure the board is working. Once this is done you should see the onboard LED blinking on the board every second.
Click on the Monitor tab to see the following in the monitor:
Humidity: 34.00%  Temperature: 18.00°C 64.40°F  Heat index: 16.74°C 62.14°F
turn LED on
Humidity: 34.00%  Temperature: 18.00°C 64.40°F  Heat index: 16.74°C 62.14°F
turn LED off
Humidity: 34.00%  Temperature: 18.00°C 64.40°F  Heat index: 16.74°C 62.14°F
turn LED on
Humidity: 34.00%  Temperature: 18.00°C 64.40°F  Heat index: 16.74°C 62.14°F
turn LED off
If you have any issues, ensure the DHT11 and LED are connected correctly, ensuring the correct pins are connected, and the polarity of the LED is correct. If all goes well, congratulations, you’ve just built a prototype weather station!
Connecting the Device to IoT Cloud
Next we’ll connect our device to the arduino cloud service. This involves the following steps:
- Adding a “thing” to represent our device and its properties.
- Connecting our device to the IoT Cloud platform.
- Associating the physical device with the thing. This causes some code to be generated to handle the thing properties.
- Updating the code needed to keep the thing properties are kept in sync with the real world weather station device sensor values and state of the LED.
To get started with Arduino Cloud you can follow the Getting started with the Arduino IoT Cloud.
We’ll go through the steps with our specific device.
Adding a Thing
In the IoT Cloud click on Things, and then the Create Thing button.
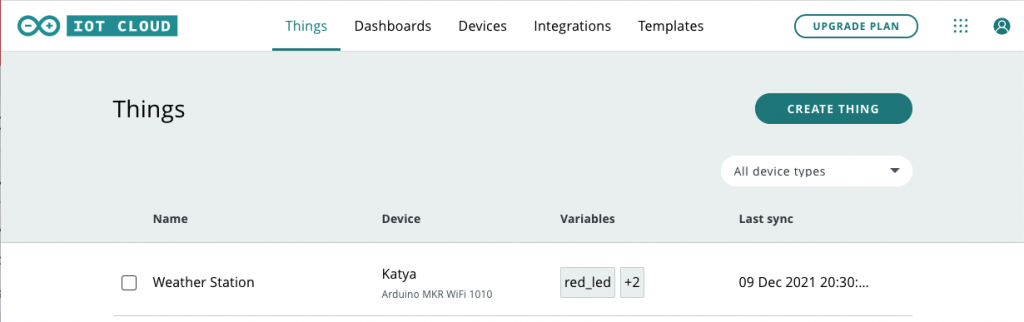
Name your thing appropriately. We used Weather Station. Then, add variables that are associated with the DHT11 sensor and the LED by clicking on Add Variable as shown.
Adding Variables to Things
Add the following variables:
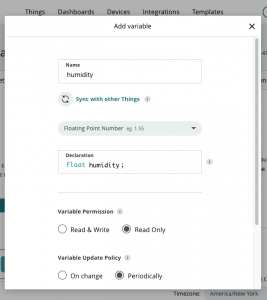
humidity – float type as shown. You should configure it in the UI as Read Only, and update periodically every 2 seconds.
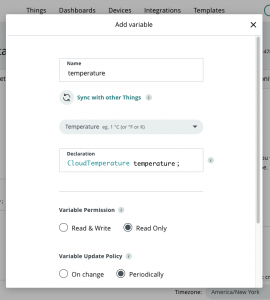
temperature – create it as a CloudTemperature type, read-only and updated every 2 seconds. The CloudTemperature type is in the Energy category of types.
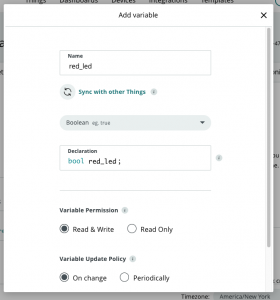
red_led – boolean type. This should be configured as Read & Write, and updated On change.
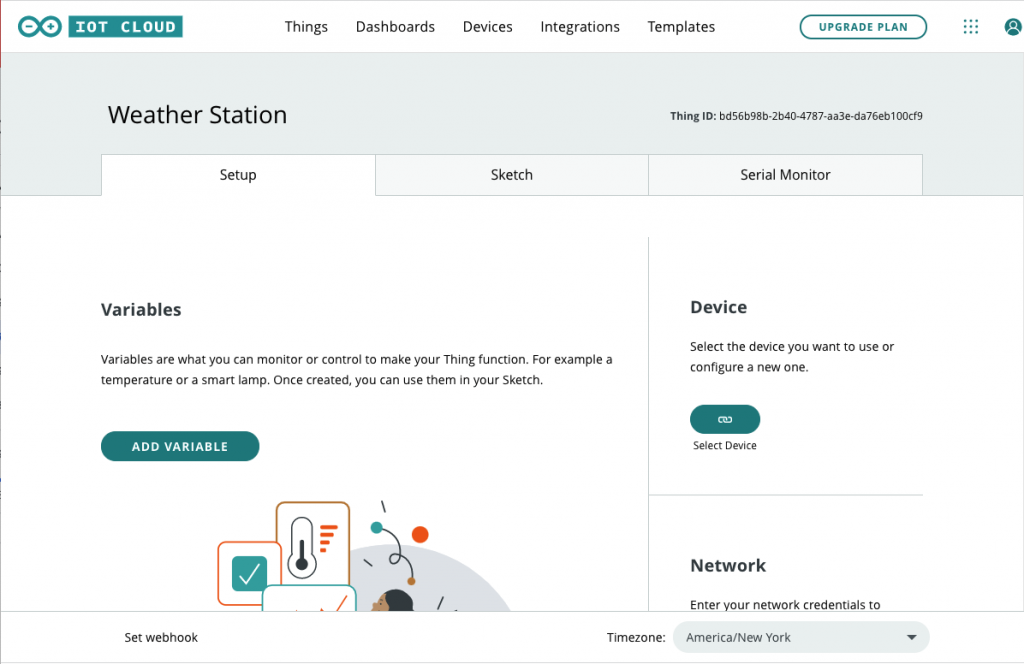
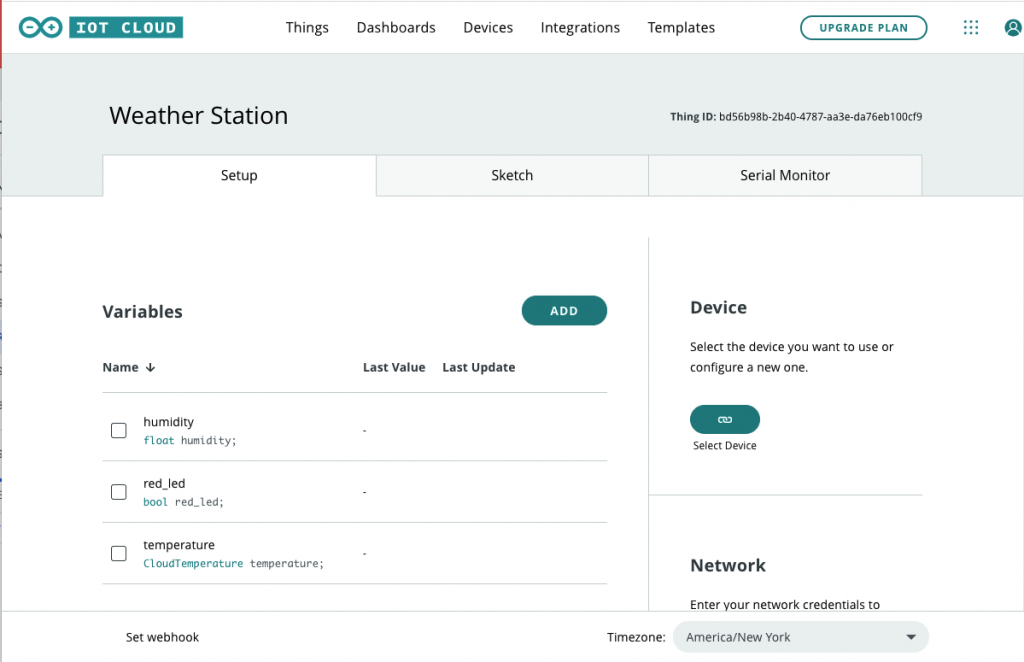
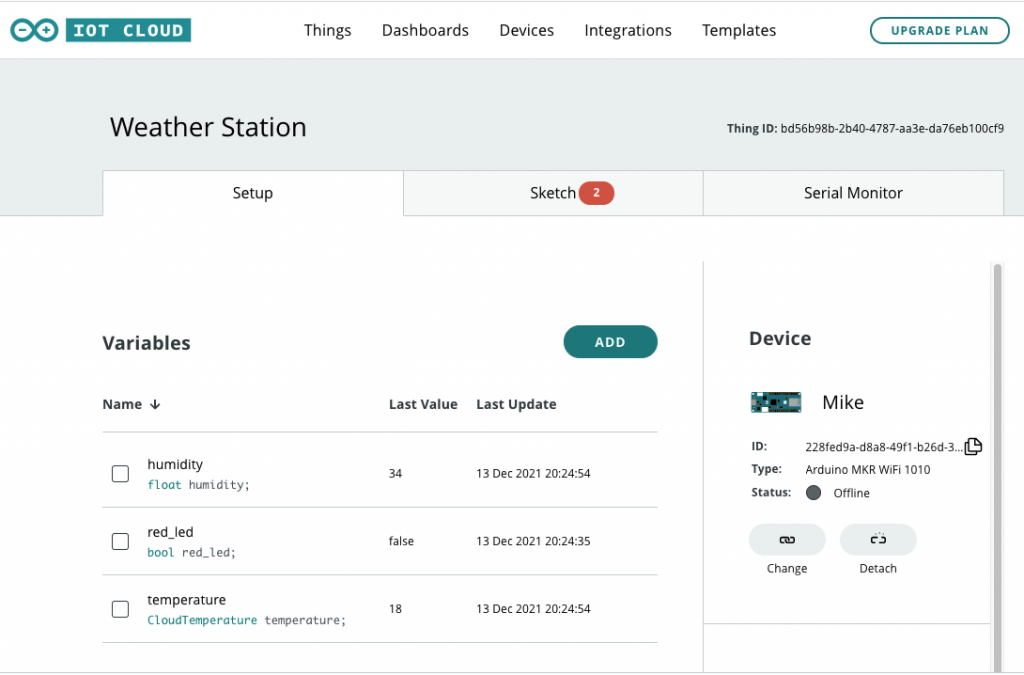
Now we have a Weather Station thing representing our device in the platform as shown.
Next, we need to connect our device to the IoT Cloud!
Connecting our Device
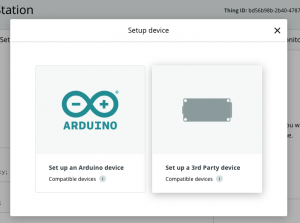
To add our device, you can click on the link/Select Device button and select an Arduino device.
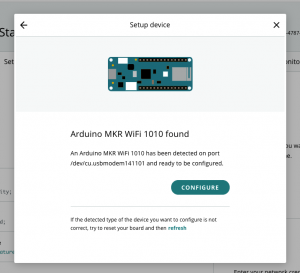
You must then wait for the platform to connect to your local device. If all goes well the browser will display something similar to the following:
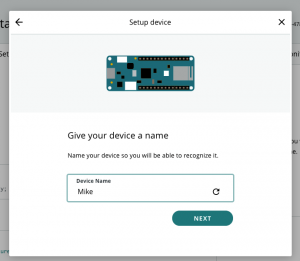
Click on configure, and give your device a name.
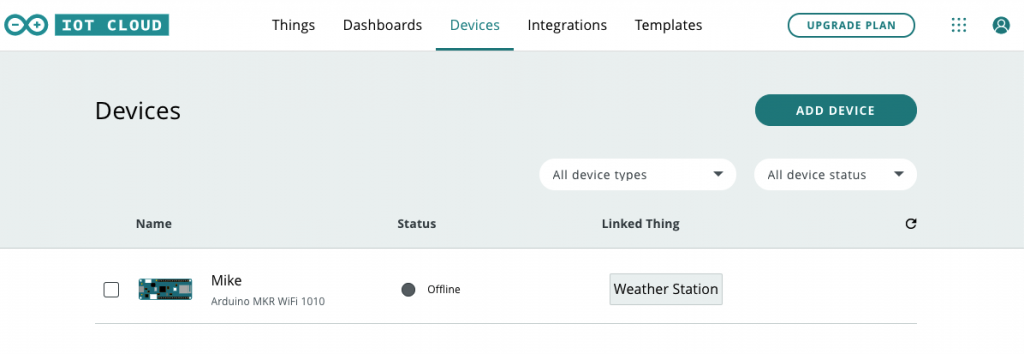
Once this is done the platform will upload a new sketch into the device that has the code necessary to communicate with the Arduino IoT Cloud. Click on Done and your device will be shown.
Note that if your device is not linked to a thing as shown you can click on the Things Tab and then click on the Associate Device on the Weather Station thing to link it to your device.
At this point, you have created a thing, added the device, and uploaded a sketch to the device to support communications with the IoT Cloud. Next we’ll modify the sketch to support the DHT11 and the LED.
Update Sketch to Update Thing Properties
To update the sketch you can click on the Sketch tab as shown below. Clock on the Open full editor button to modify the sketch and its configuration in the Web Editor.
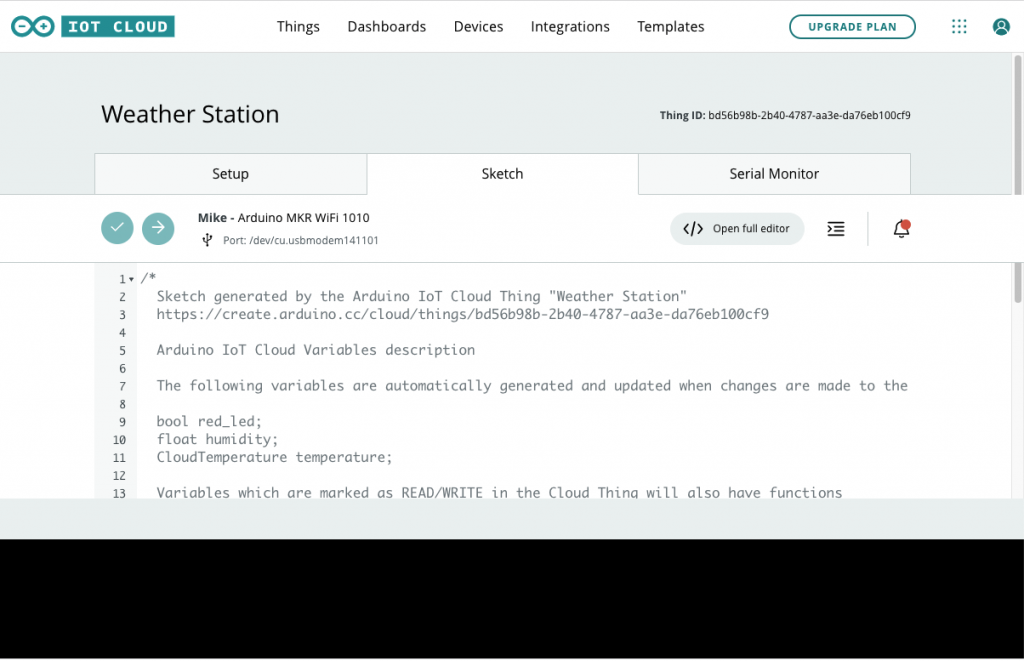
Your Editor will look something like the following.
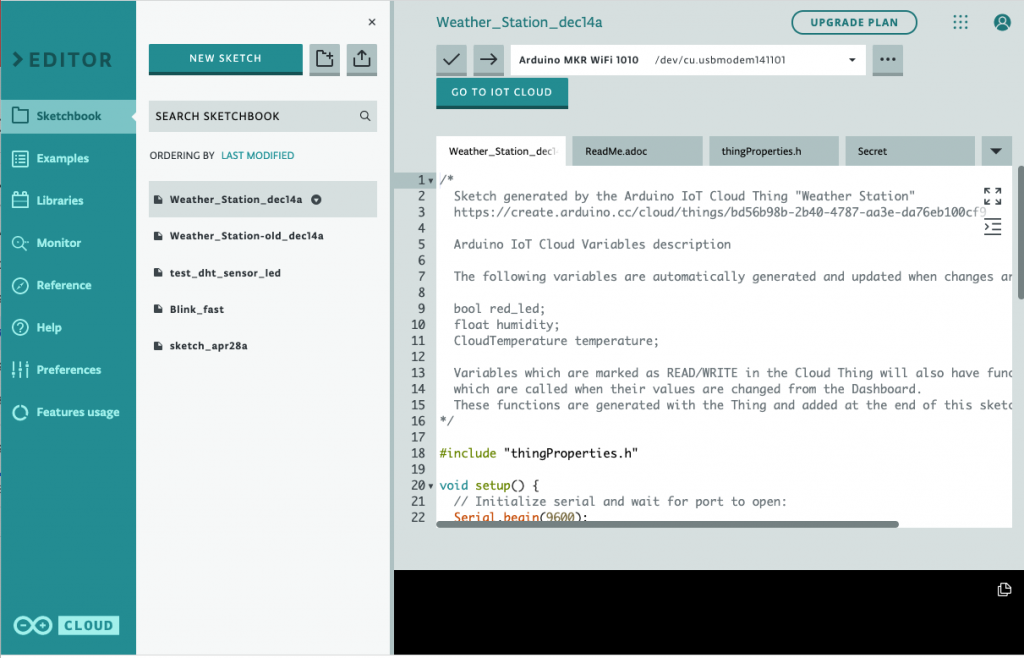
Click on the Secret tab and ensure the SSID and password for your wifi network is set correctly.
Notice the template sketch provided by the platform (See Appendix Listing 2) provides placeholders for you to fill in the loop code and onRedLedChange() with your own code. This is where we need to add the code to read our sensor and turn the LED on and off.
Before we can read the DHT11 we need to include the library. Click on the Libraries tab and then your favourites for the DHT11 library, and then Include the DHT11 library.
Now, replace the sketch generated by the platform with the code in Appendix Listing 3 following (copy paste into the same file). This will fill in the loop() and onRedLedChange() methods and set up the DHT11 sensor reading.
Click on the Upload and Save -> button to upload and save this new sketch into the Arduino. If all goes well, your device will now keep the IoT platform thing variables up to date as shown.
Developing Node-RED Flow on FRED
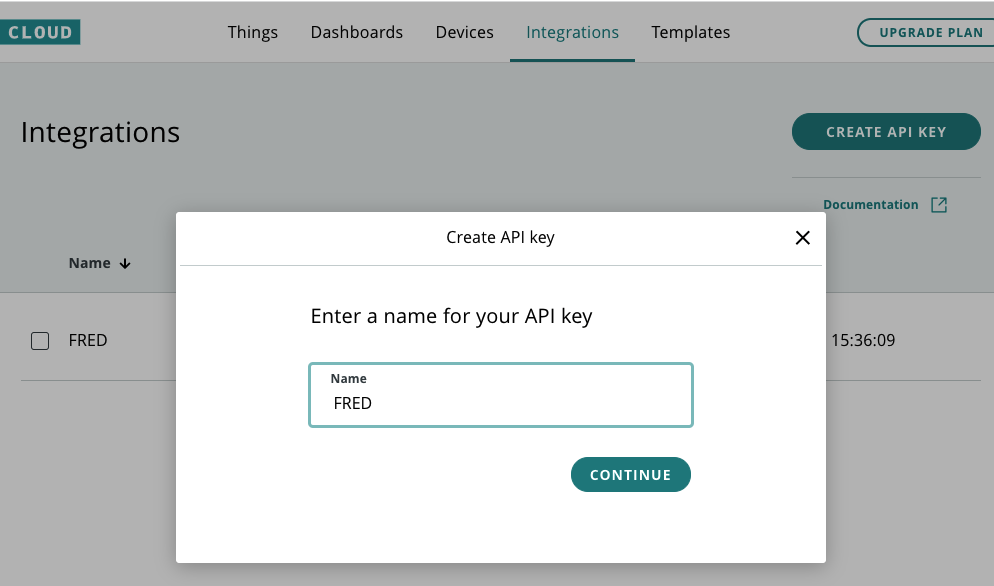
Next we’ll create an API key on the IoT Cloud to connect to FRED to do additional processing and notifications.
First, click on the Integrations tab, and then click on Create API Key. Give the API key a name such as FRED.
Setting up the cloud Hosted Node-RED service
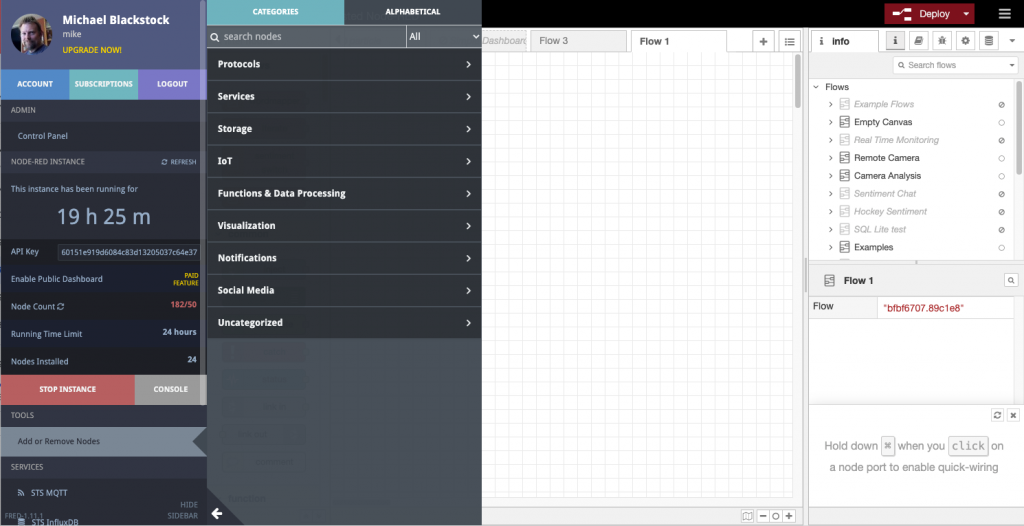
Create an account on the your cloud-hosted Node-REd service of choice. We originally used FRED – however it is no longer available.
Once you’ve created an account and validated your email, you will be able to login and see a standard Node-RED instance for creating your flows. Before we can create our flow we need to install the Arduino IoT Cloud nodes. Click on the Add or Remove Nodes tab on the left as shown below.
If you are new to Node-RED, you can find several introductory tutorials and a complete programming course at our Node-RED programming guide.
Search for Arduio and install the Ardiuno-Iot-Cloud nodes. For debugging and simple charts we’ll use the Dataviewer node, and the Pushbullet node for notifications; install those as well.
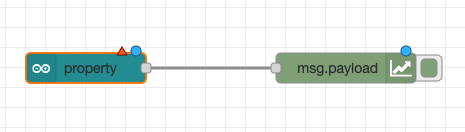
We’ll initially create a flow that connects to the IoT Cloud and displays information and controls the LED.
First, drag a property node, and a data viewer node to display the data in a chart in the flow as shown.
Next, configure the property node by double-clicking on it. You’ll get the following modal.
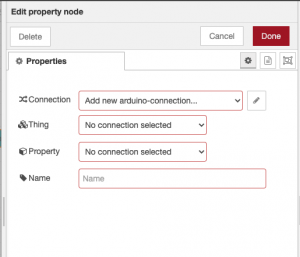
Create a new arduino-connection by clicking on the pencil icon and fill in your Client ID and Client Secret you recorded when you configured your integration.
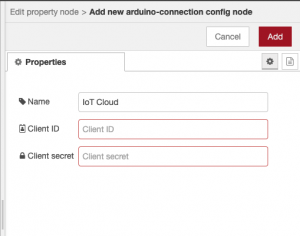
Click on Add. Your property node is now configured. The node will communicate with the IoT cloud to retrieve the Things and properties it can interact with.
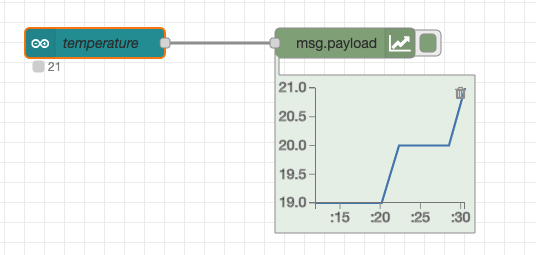
Select the thing for the property, “Weather Station”, and the temperature property.
Deploy the simple two node flow, and if all goes well, temperature readings should begin to appear in the data viewer. The current value also appears under the property node as shown. To see the values themselves, you may add a debug node to the property output as well.
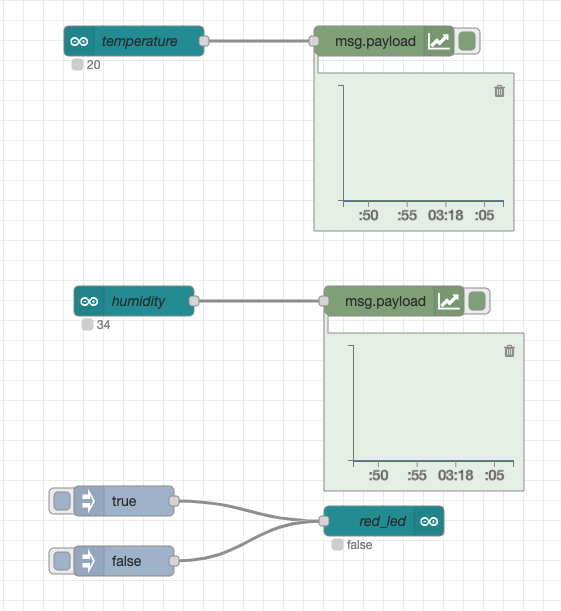
Congratulations, you’ve connected FRED to the Arduino IoT Cloud! Next, we’ll add the humidity and LED control nodes using the following flow.
The flow illustrated above is shown in Appendix Listing 4. You can import this flow by Click on the hamburger icon in the top right, choosing Import and then copying and pasting this listing into the import dialog as described in the Node-RED documentation.
Given a few seconds you should now see both the current temperature and humidity readings and have the ability to control the LED.
Going Further: Adding High Temperature Notifications
Let’s take this a bit further and create a flow that lights the LED and sends a notification when the temperature rises above 20 degrees. We’ll then extend this to send notifications via Pushbullet. First, we’ll create a flow to detect the temperature and light the LED.
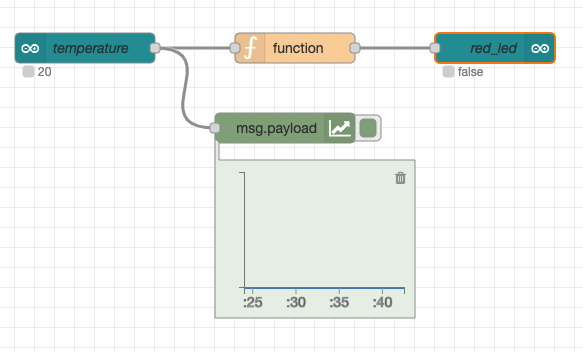
The flow shown above can be imported from Appendix Listing 5. Note that the function node here is very simple; it sends a true or false in the output message payload depending the value of the message payload received:
if (msg.payload > 20) {
    msg.payload = true;
} else {
    msg.payload = false;
}
return msg;
This can easily be extended to do additional processing, perhaps a dynamic threshold, or check that the temperature is below freezing.
Connecting to Pushbullet
Next, let’s connect Pushbullet for remote notifications. To use this service, you’ll need to sign up, install Pushbullet on your phone or computer and then create an API key.
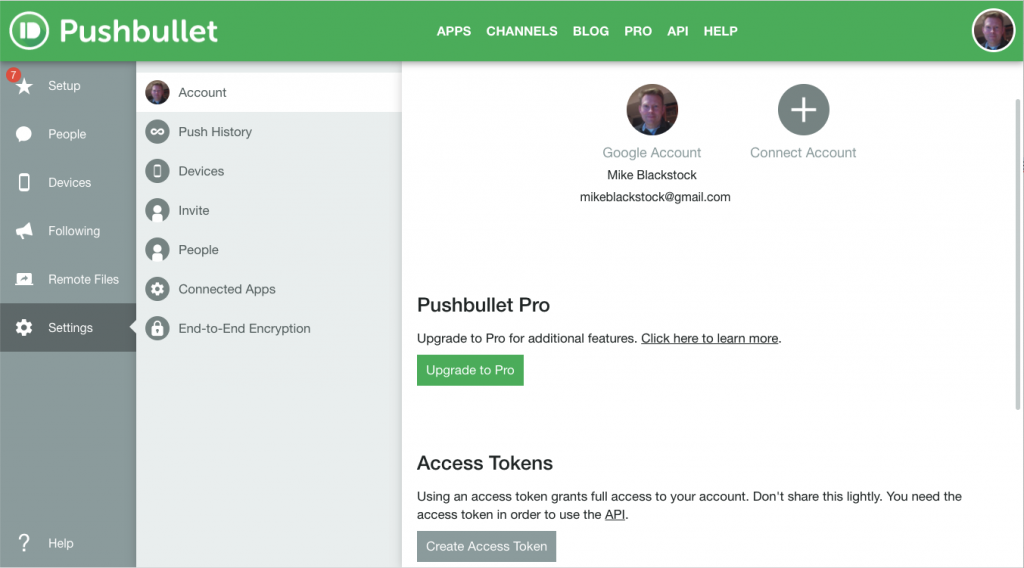
Record the API key (access token) provided; this will be used to connect FRED to pushbullet.
Now, add a pushbullet node to your flow as shown. Configure it to push to your devices by providing the API key.
Now, you can modify the flow to include a function node to send notifications to Pushbullet when the temperature test transitions to true as shown.
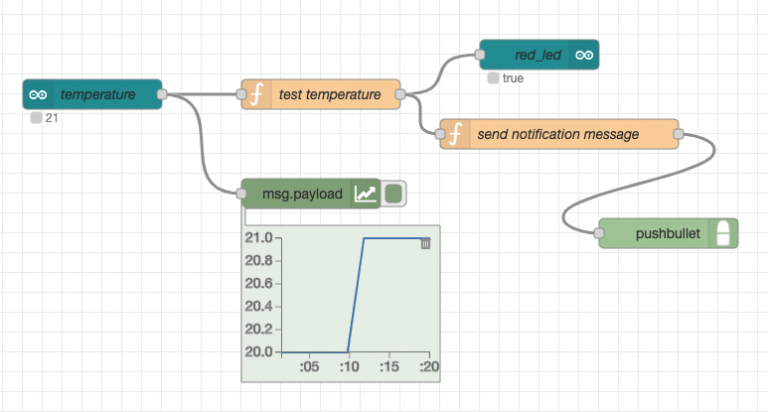
The associated flow can be imported from Appendix Listing 6.
Note that the send notification function node uses the Node-RED context feature to maintain state about whether a notification has been sent already. For more information on how Node-RED context works see the associated documentation.
The function Setup code (in the function node Setup tab) is as follows:
if (context.get("notificationSent") === undefined) {
    context.set("notificationSent", false);
}
The function node code that sends the notification is as follows:
let notificationSent = context.get("notificationSent");

if (msg.payload) {
    if (!notificationSent) {
        msg.payload = "Temperature is too high!"
        context.set("notificationSent", true);
        return msg;
    }
} else {
    context.set("notificationSent", false);
}
Now, when the temperature transitions more than 20 degrees, the LED will light, and you’ll get a Pushbullet notification on your device!
Note that free pushbullet accounts are limited to 500 notifications per month so do not leave this flow running otherwise you may exceed your limit!
Conclusion
The Arduino IoT Cloud makes it very easy to connect Arduino devices and visualize basic sensor data. However, if you want to create simple IoT applications for monitoring and control, then you need a general purpose service such as FRED. By combining FRED and the Arduino IoT Cloud, you get the ease of connectivity of Arduino and the power and flexibility of FRED – a winning combination!
Appendix
This appendix contains the Arduino device sketches and Node-RED flows hosted by FRED that needed for this tutorial.
Listing 1
Test program for the weather station prototype device
Open to view/copy code
/*
  Test weather station sketch
*/
#include <DHT.h>
#include <DHT_U.h>

#define DHTPIN 2
#define DHTTYPE DHT11

const int ALERT_LED = 8;      // the number of the LED pin
bool led_state = false;

DHT dht(DHTPIN, DHTTYPE);

void setup() {
  pinMode(ALERT_LED, OUTPUT);

  // initialize the DHT sensor
  dht.begin();

  // Initialize serial and wait for port to open:
  Serial.begin(9600);

  // This delay gives the chance to wait for a Serial Monitor
  // without blocking if none is found
  delay(1500);
}

void loop() {
  delay(2000);

  // Reading temperature or humidity takes about 250 milliseconds!
  // Sensor readings may also be up to 2 seconds 'old'
  // (its a very slow sensor)
  float h = dht.readHumidity();

  // Read temperature as Celsius (the default)
  float t = dht.readTemperature();

  // Read temperature as Fahrenheit (isFahrenheit = true)
  float f = dht.readTemperature(true);

  // Check if any reads failed and exit early (to try again).
  if (isnan(h) || isnan(t) || isnan(f)) {
    Serial.println(F("Failed to read from DHT sensor!"));
    return;
  }

  // Compute heat index in Fahrenheit (the default)
  float hif = dht.computeHeatIndex(f, h);
  // Compute heat index in Celsius (isFahreheit = false)
  float hic = dht.computeHeatIndex(t, h, false);

  Serial.print(F("Humidity: "));
  Serial.print(h);
  Serial.print(F("%  Temperature: "));
  Serial.print(t);
  Serial.print(F("°C "));
  Serial.print(f);
  Serial.print(F("°F  Heat index: "));
  Serial.print(hic);
  Serial.print(F("°C "));
  Serial.print(hif);
  Serial.println(F("°F"));

  if (led_state) {
    Serial.println("turn LED on");
    digitalWrite(ALERT_LED, HIGH);
    led_state = false;
  } else {
    Serial.println("turn LED off");
    digitalWrite(ALERT_LED, LOW);
    led_state = true;
  }
}
Listing 2
Template sketch generated by the IoT Cloud to communicate with the IoT Cloud that provides placeholders to update variables.
Open to view/copy code
/*
  Sketch generated by the Arduino IoT Cloud Thing "Weather Station"
  https://create.arduino.cc/cloud/things/xxx-xxx-xxx-xxx-xxx

  Arduino IoT Cloud Variables description

  The following variables are automatically generated and updated when changes are made to the Thing

  bool red_led;
  float humidity;
  CloudTemperature temperature;

  Variables which are marked as READ/WRITE in the Cloud Thing will also have functions
  which are called when their values are changed from the Dashboard.
  These functions are generated with the Thing and added at the end of this sketch.
*/

#include "thingProperties.h"

void setup() {
  // Initialize serial and wait for port to open:
  Serial.begin(9600);
  // This delay gives the chance to wait for a Serial Monitor without blocking if none is found
  delay(1500);

  // Defined in thingProperties.h
  initProperties();

  // Connect to Arduino IoT Cloud
  ArduinoCloud.begin(ArduinoIoTPreferredConnection);

  /*
     The following function allows you to obtain more information
     related to the state of network and IoT Cloud connection and errors
     the higher number the more granular information you’ll get.
     The default is 0 (only errors).
     Maximum is 4
 */
  setDebugMessageLevel(2);
  ArduinoCloud.printDebugInfo();
}

void loop() {
  ArduinoCloud.update();
  // Your code here


}

/*
  Since RedLed is READ_WRITE variable, onRedLedChange() is
  executed every time a new value is received from IoT Cloud.
*/
void onRedLedChange()  {
  // Add your code here to act upon RedLed change
}
Listing 3
Weather station prototype sketch to update humidity, temperature based on DHT11 readings and turn the red LED and off based on the state of the red_led variable.
Open to view/copy code
// DHT sensor library - Version: Latest
#include <DHT.h>
#include <DHT_U.h>
#include "thingProperties.h"

const int ALERT_LED = 8;      // the number of the LED pin

#define DHTPIN 2
#define DHTTYPE DHT11

DHT dht(DHTPIN, DHTTYPE);

void setup() {
  pinMode(LED_BUILTIN, OUTPUT);
  pinMode(ALERT_LED, OUTPUT);

  // initialize the DHT sensor
  dht.begin();

  // Initialize serial and wait for port to open:
  Serial.begin(9600);
  // This delay gives the chance to wait for a Serial Monitor
  delay(1500);

  // Defined in thingProperties.h
  initProperties();

  // Connect to Arduino IoT Cloud
  ArduinoCloud.begin(ArduinoIoTPreferredConnection);

  /*
     The following function allows you to obtain more information
     related to the state of network and IoT Cloud connection and errors
     the higher number the more granular information you’ll get.
     The default is 0 (only errors).
     Maximum is 4
 */
  setDebugMessageLevel(2);
  ArduinoCloud.printDebugInfo();
}

void loop() {
  ArduinoCloud.update();
  // Your code here
  delay(2000);

  // Reading temperature or humidity takes about 250 milliseconds!
  // Sensor readings may also be up to 2 seconds 'old'
  // (its a very slow sensor)
  float h = dht.readHumidity();

  // Read temperature as Celsius (the default)
  float t = dht.readTemperature();

  // Read temperature as Fahrenheit (isFahrenheit = true)
  float f = dht.readTemperature(true);

  // Check if any reads failed and exit early (to try again).
  if (isnan(h) || isnan(t) || isnan(f)) {
    Serial.println(F("Failed to read from DHT sensor!"));
    return;
  }

  // Compute heat index in Fahrenheit (the default)
  float hif = dht.computeHeatIndex(f, h);
  // Compute heat index in Celsius (isFahreheit = false)
  float hic = dht.computeHeatIndex(t, h, false);

  temperature = t;
  humidity = h;

  Serial.print(F("Humidity: "));
  Serial.print(h);
  Serial.print(F("%  Temperature: "));
  Serial.print(t);
  Serial.print(F("°C "));
  Serial.print(f);
  Serial.print(F("°F  Heat index: "));
  Serial.print(hic);
  Serial.print(F("°C "));
  Serial.print(hif);
  Serial.println(F("°F"));
}

/*
  Since RedLed is READ_WRITE variable, onRedLedChange() is
  executed every time a new value is received from IoT Cloud.
*/
void onRedLedChange()  {
  // Add your code here to act upon RedLed change
  if (red_led) {
    Serial.println("red_led on");
    digitalWrite(ALERT_LED, HIGH);
  } else {
    Serial.println("red_led off");
    digitalWrite(ALERT_LED, LOW);
  }
}
Listing 4
Node-RED Flow to display temperature, humidity using data viewer nodes and control the red LED using inject nodes.
Accordion Title
[
    {
        "id": "ad260a66.fea098",
        "type": "property in",
        "z": "bfbf6707.89c1e8",
        "connection": "f4c46bfe.1d2748",
        "thing": "bd56b98b-2b40-4787-aa3e-da76eb100cf9",
        "property": "920f2567-7df8-408a-9c93-814d76d34b35",
        "name": "temperature",
        "propname": "temperature",
        "defaultname": true,
        "variableName": "temperature",
        "x": 190,
        "y": 200,
        "wires": [
            [
                "a4e71cd0.afb4b"
            ]
        ]
    },
    {
        "id": "a4e71cd0.afb4b",
        "type": "data-view",
        "z": "bfbf6707.89c1e8",
        "name": "",
        "property": "payload",
        "fieldType": "msg",
        "width": 200,
        "height": 160,
        "points": 10,
        "active": true,
        "passthru": false,
        "hide": true,
        "outputs": 0,
        "x": 440,
        "y": 200,
        "wires": []
    },
    {
        "id": "f4808533.8eff58",
        "type": "property in",
        "z": "bfbf6707.89c1e8",
        "connection": "f4c46bfe.1d2748",
        "thing": "bd56b98b-2b40-4787-aa3e-da76eb100cf9",
        "property": "69cf78e4-8f87-4cea-8741-106b5ebec761",
        "name": "humidity",
        "propname": "humidity",
        "defaultname": true,
        "variableName": "humidity",
        "x": 190,
        "y": 460,
        "wires": [
            [
                "28d52b3f.d1d694"
            ]
        ]
    },
    {
        "id": "28d52b3f.d1d694",
        "type": "data-view",
        "z": "bfbf6707.89c1e8",
        "name": "",
        "property": "payload",
        "fieldType": "msg",
        "width": 200,
        "height": 160,
        "points": 10,
        "active": true,
        "passthru": false,
        "hide": true,
        "outputs": 0,
        "x": 450,
        "y": 460,
        "wires": []
    },
    {
        "id": "c59a0433.d9ee28",
        "type": "property out",
        "z": "bfbf6707.89c1e8",
        "connection": "f4c46bfe.1d2748",
        "thing": "bd56b98b-2b40-4787-aa3e-da76eb100cf9",
        "property": "08ef1d84-3d38-4541-bcf8-7155540f841d",
        "name": "red_led",
        "propname": "red_led",
        "defaultname": true,
        "x": 440,
        "y": 680,
        "wires": []
    },
    {
        "id": "e4731397.15691",
        "type": "inject",
        "z": "bfbf6707.89c1e8",
        "name": "",
        "props": [
            {
                "p": "payload"
            },
            {
                "p": "topic",
                "vt": "str"
            }
        ],
        "repeat": "",
        "crontab": "",
        "once": false,
        "onceDelay": 0.1,
        "topic": "",
        "payload": "true",
        "payloadType": "bool",
        "x": 180,
        "y": 660,
        "wires": [
            [
                "c59a0433.d9ee28"
            ]
        ]
    },
    {
        "id": "fa7575e9.2ca8f8",
        "type": "inject",
        "z": "bfbf6707.89c1e8",
        "name": "",
        "props": [
            {
                "p": "payload"
            },
            {
                "p": "topic",
                "vt": "str"
            }
        ],
        "repeat": "",
        "crontab": "",
        "once": false,
        "onceDelay": 0.1,
        "topic": "",
        "payload": "false",
        "payloadType": "bool",
        "x": 180,
        "y": 720,
        "wires": [
            [
                "c59a0433.d9ee28"
            ]
        ]
    },
    {
        "id": "f4c46bfe.1d2748",
        "type": "arduino-connection",
        "applicationname": "IoT Cloud"
    }
]
Listing 5
Flow to light the red LED when the temperature rises above 20 degrees.
[
    {
        "id": "93e44a06.81f868",
        "type": "property in",
        "z": "a8d29cdf.fe1dd",
        "connection": "f4c46bfe.1d2748",
        "thing": "bd56b98b-2b40-4787-aa3e-da76eb100cf9",
        "property": "920f2567-7df8-408a-9c93-814d76d34b35",
        "name": "temperature",
        "propname": "temperature",
        "defaultname": true,
        "variableName": "temperature",
        "x": 130,
        "y": 160,
        "wires": [
            [
                "86194a5b.fc3188",
                "b5175095.a84f5"
            ]
        ]
    },
    {
        "id": "86194a5b.fc3188",
        "type": "function",
        "z": "a8d29cdf.fe1dd",
        "name": "",
        "func": "if (msg.payload > 20) {\n    msg.payload = true;\n} else {\n    msg.payload = false;\n}\nreturn msg;\n",
        "outputs": 1,
        "noerr": 0,
        "initialize": "",
        "finalize": "",
        "x": 340,
        "y": 160,
        "wires": [
            [
                "f658a4f6.4d72f8"
            ]
        ]
    },
    {
        "id": "b5175095.a84f5",
        "type": "data-view",
        "z": "a8d29cdf.fe1dd",
        "name": "",
        "property": "payload",
        "fieldType": "msg",
        "width": 200,
        "height": 160,
        "points": 10,
        "active": true,
        "passthru": false,
        "hide": true,
        "outputs": 0,
        "x": 330,
        "y": 240,
        "wires": []
    },
    {
        "id": "f658a4f6.4d72f8",
        "type": "property out",
        "z": "a8d29cdf.fe1dd",
        "connection": "f4c46bfe.1d2748",
        "thing": "bd56b98b-2b40-4787-aa3e-da76eb100cf9",
        "property": "08ef1d84-3d38-4541-bcf8-7155540f841d",
        "name": "red_led",
        "propname": "red_led",
        "defaultname": true,
        "x": 540,
        "y": 160,
        "wires": []
    },
    {
        "id": "f4c46bfe.1d2748",
        "type": "arduino-connection",
        "applicationname": "IoT Cloud"
    }
]
Listing 6
Flow that sends notifications when the threshold rises above 20 degrees.
Note that you are limited to only 500 notifications per month, so do not leave this flow running too long!
[
    {
        "id": "93e44a06.81f868",
        "type": "property in",
        "z": "a8d29cdf.fe1dd",
        "connection": "f4c46bfe.1d2748",
        "thing": "bd56b98b-2b40-4787-aa3e-da76eb100cf9",
        "property": "920f2567-7df8-408a-9c93-814d76d34b35",
        "name": "temperature",
        "propname": "temperature",
        "defaultname": true,
        "variableName": "temperature",
        "x": 110,
        "y": 140,
        "wires": [
            [
                "86194a5b.fc3188",
                "b5175095.a84f5"
            ]
        ]
    },
    {
        "id": "86194a5b.fc3188",
        "type": "function",
        "z": "a8d29cdf.fe1dd",
        "name": "test temperature",
        "func": "if (msg.payload > 20) {\n    msg.payload = true;\n} else {\n    msg.payload = false;\n}\nreturn msg;\n",
        "outputs": 1,
        "noerr": 0,
        "initialize": "",
        "finalize": "",
        "x": 340,
        "y": 140,
        "wires": [
            [
                "f658a4f6.4d72f8",
                "1c64469f.67b679"
            ]
        ]
    },
    {
        "id": "b5175095.a84f5",
        "type": "data-view",
        "z": "a8d29cdf.fe1dd",
        "name": "",
        "property": "payload",
        "fieldType": "msg",
        "width": 200,
        "height": 160,
        "points": 10,
        "active": true,
        "passthru": false,
        "hide": true,
        "outputs": 0,
        "x": 330,
        "y": 240,
        "wires": []
    },
    {
        "id": "f658a4f6.4d72f8",
        "type": "property out",
        "z": "a8d29cdf.fe1dd",
        "connection": "f4c46bfe.1d2748",
        "thing": "bd56b98b-2b40-4787-aa3e-da76eb100cf9",
        "property": "08ef1d84-3d38-4541-bcf8-7155540f841d",
        "name": "red_led",
        "propname": "red_led",
        "defaultname": true,
        "x": 560,
        "y": 100,
        "wires": []
    },
    {
        "id": "432d96f7.6fb348",
        "type": "pushbullet",
        "z": "a8d29cdf.fe1dd",
        "config": "6af4f9cc.950b08",
        "pushtype": "note",
        "title": "",
        "chan": "",
        "name": "",
        "x": 690,
        "y": 280,
        "wires": []
    },
    {
        "id": "1c64469f.67b679",
        "type": "function",
        "z": "a8d29cdf.fe1dd",
        "name": "send notification message",
        "func": "let notificationSent = context.get(\"notificationSent\");\n\nif (msg.payload) {\n    if (!notificationSent) {\n        msg.payload = \"Temperature is too high!\"\n        context.set(\"notificationSent\", true);\n        return msg;   \n    }\n} else {\n    context.set(\"notificationSent\", false);\n}\n",
        "outputs": 1,
        "noerr": 0,
        "initialize": "if (context.get(\"notificationSent\") === undefined) {\n    context.set(\"notificationSent\", false);\n}\n",
        "finalize": "",
        "x": 580,
        "y": 180,
        "wires": [
            [
                "432d96f7.6fb348"
            ]
        ]
    },
    {
        "id": "f4c46bfe.1d2748",
        "type": "arduino-connection",
        "applicationname": "IoT Cloud"
    },
    {
        "id": "6af4f9cc.950b08",
        "type": "pushbullet-config",
        "name": "Mike Pushbullet"
    }
]
JavaScript primer
JavaScript Primer
While we don’t have enough space here to cover JavaScript completely, here is a quick overview for those familiar with other programming languages to get started writing your own nodes. To experiment with JavaScript, you can use the JavaScript console supplied with your favourite browser or startup Continue reading “JavaScript primer”